Docker Overview - Zabbix
Grafana dashboard with Zabbix as the data source severing as a docker overview
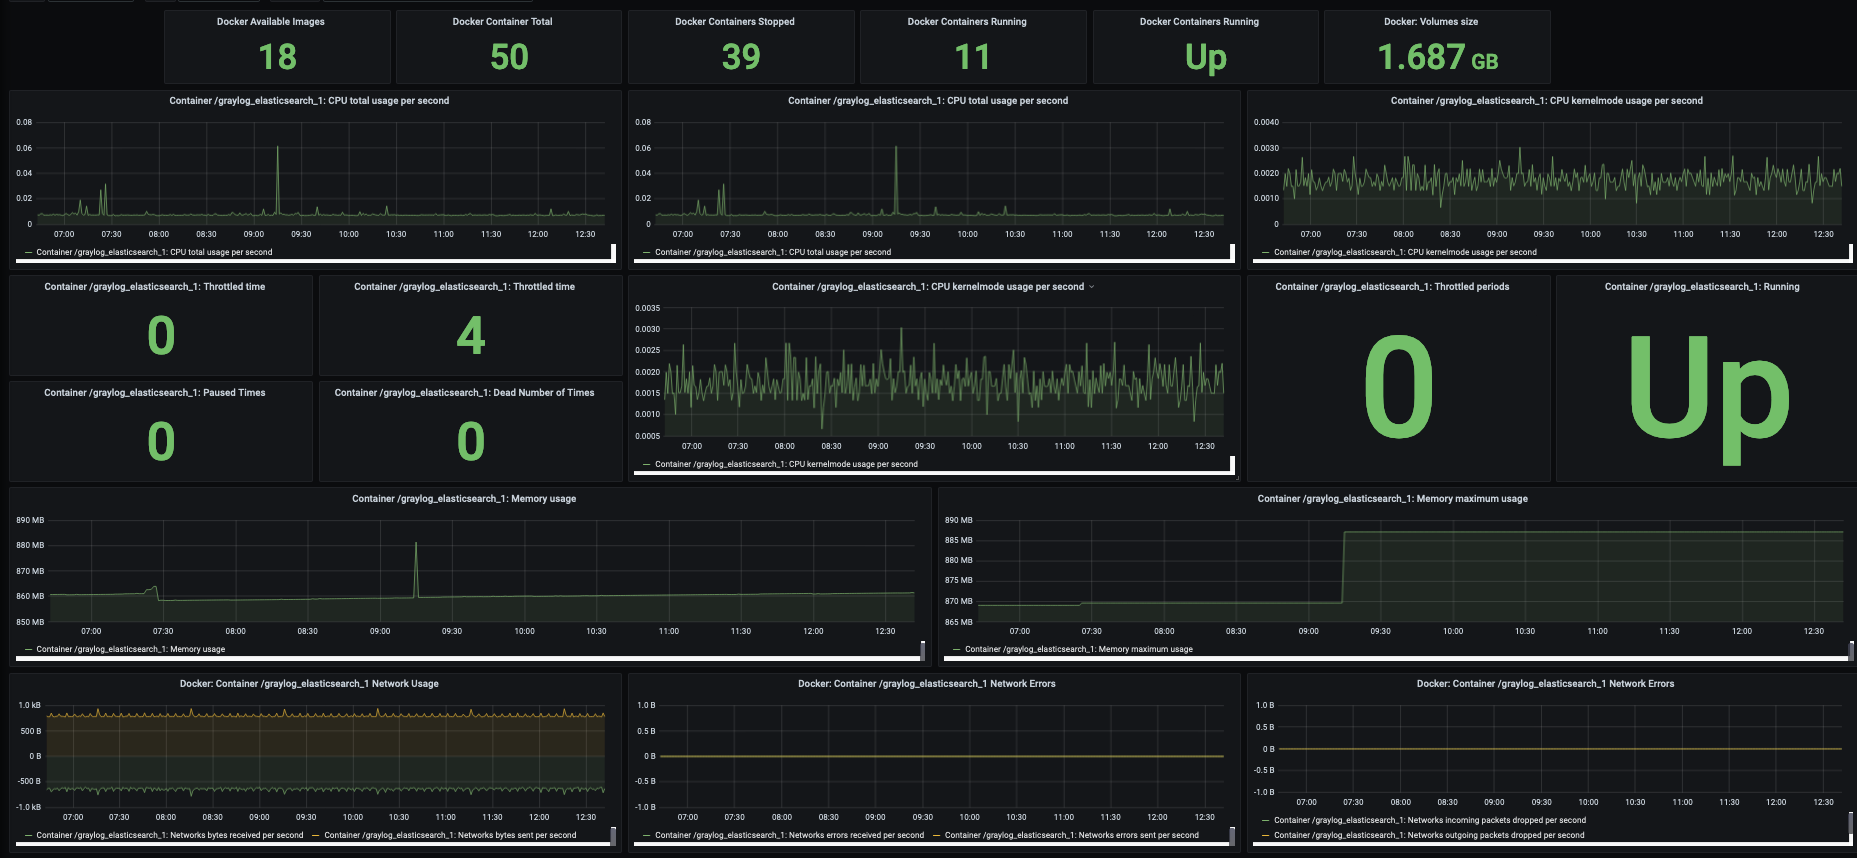
Docker Overview - Zabbix
This dashboard enabled the use of zabbix as a datasource for Docker metrics, in order to use this data source you will need to install the Zabbix plugin for Grafana

As of 17/09/2020 the instructions on the plugin page did not work for me on the latest version of Grafana, so replace the provived command to install with
sudo grafana-cli plugins install alexanderzobnin-zabbix-app 3.12.4
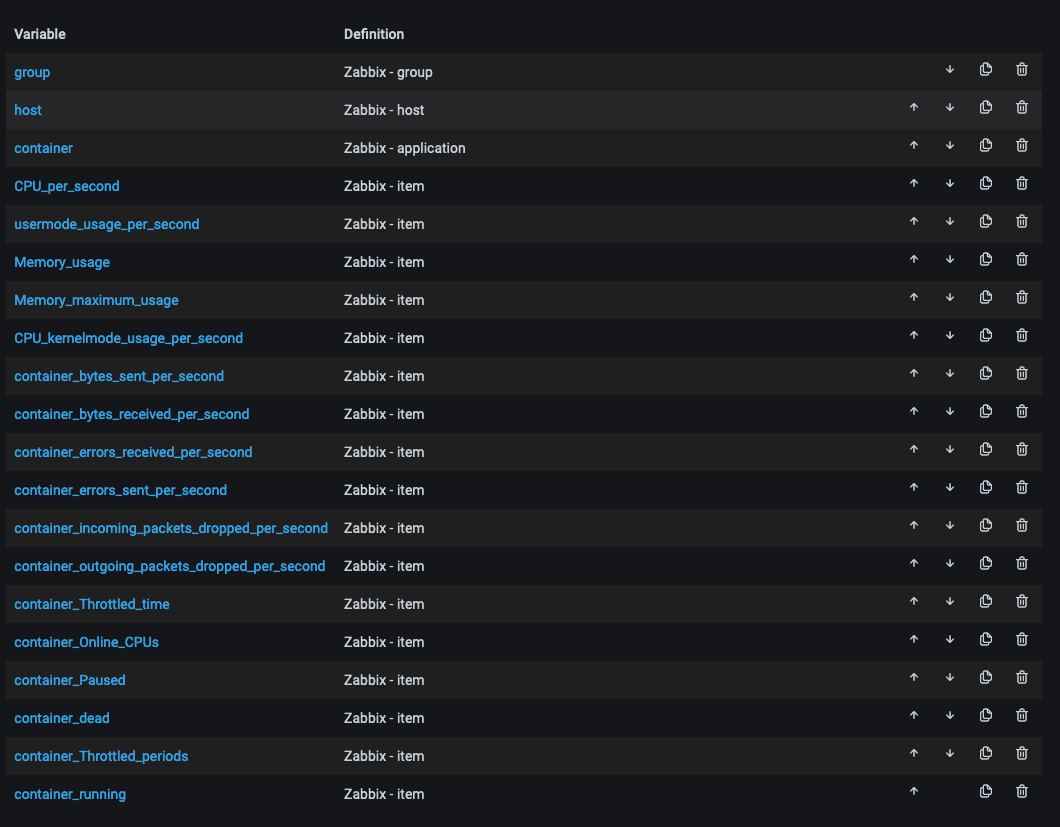
In order to tweak this to your needs I would advise you to change the group and host variables, replace the value /Zabbix servers/ with the Zabbix Group that your docker host resided in.
 Following this you will likely also need to change the host variable, in this change the value
 /Zabbix server/with the host name of your docker host.

Data source config
Collector config:
Upload an updated version of an exported dashboard.json file from Grafana
| Revision | Description | Created | |
|---|---|---|---|
| Download |
Docker
Easily monitor Docker with Grafana Cloud's out-of-the-box monitoring solution.
Learn more