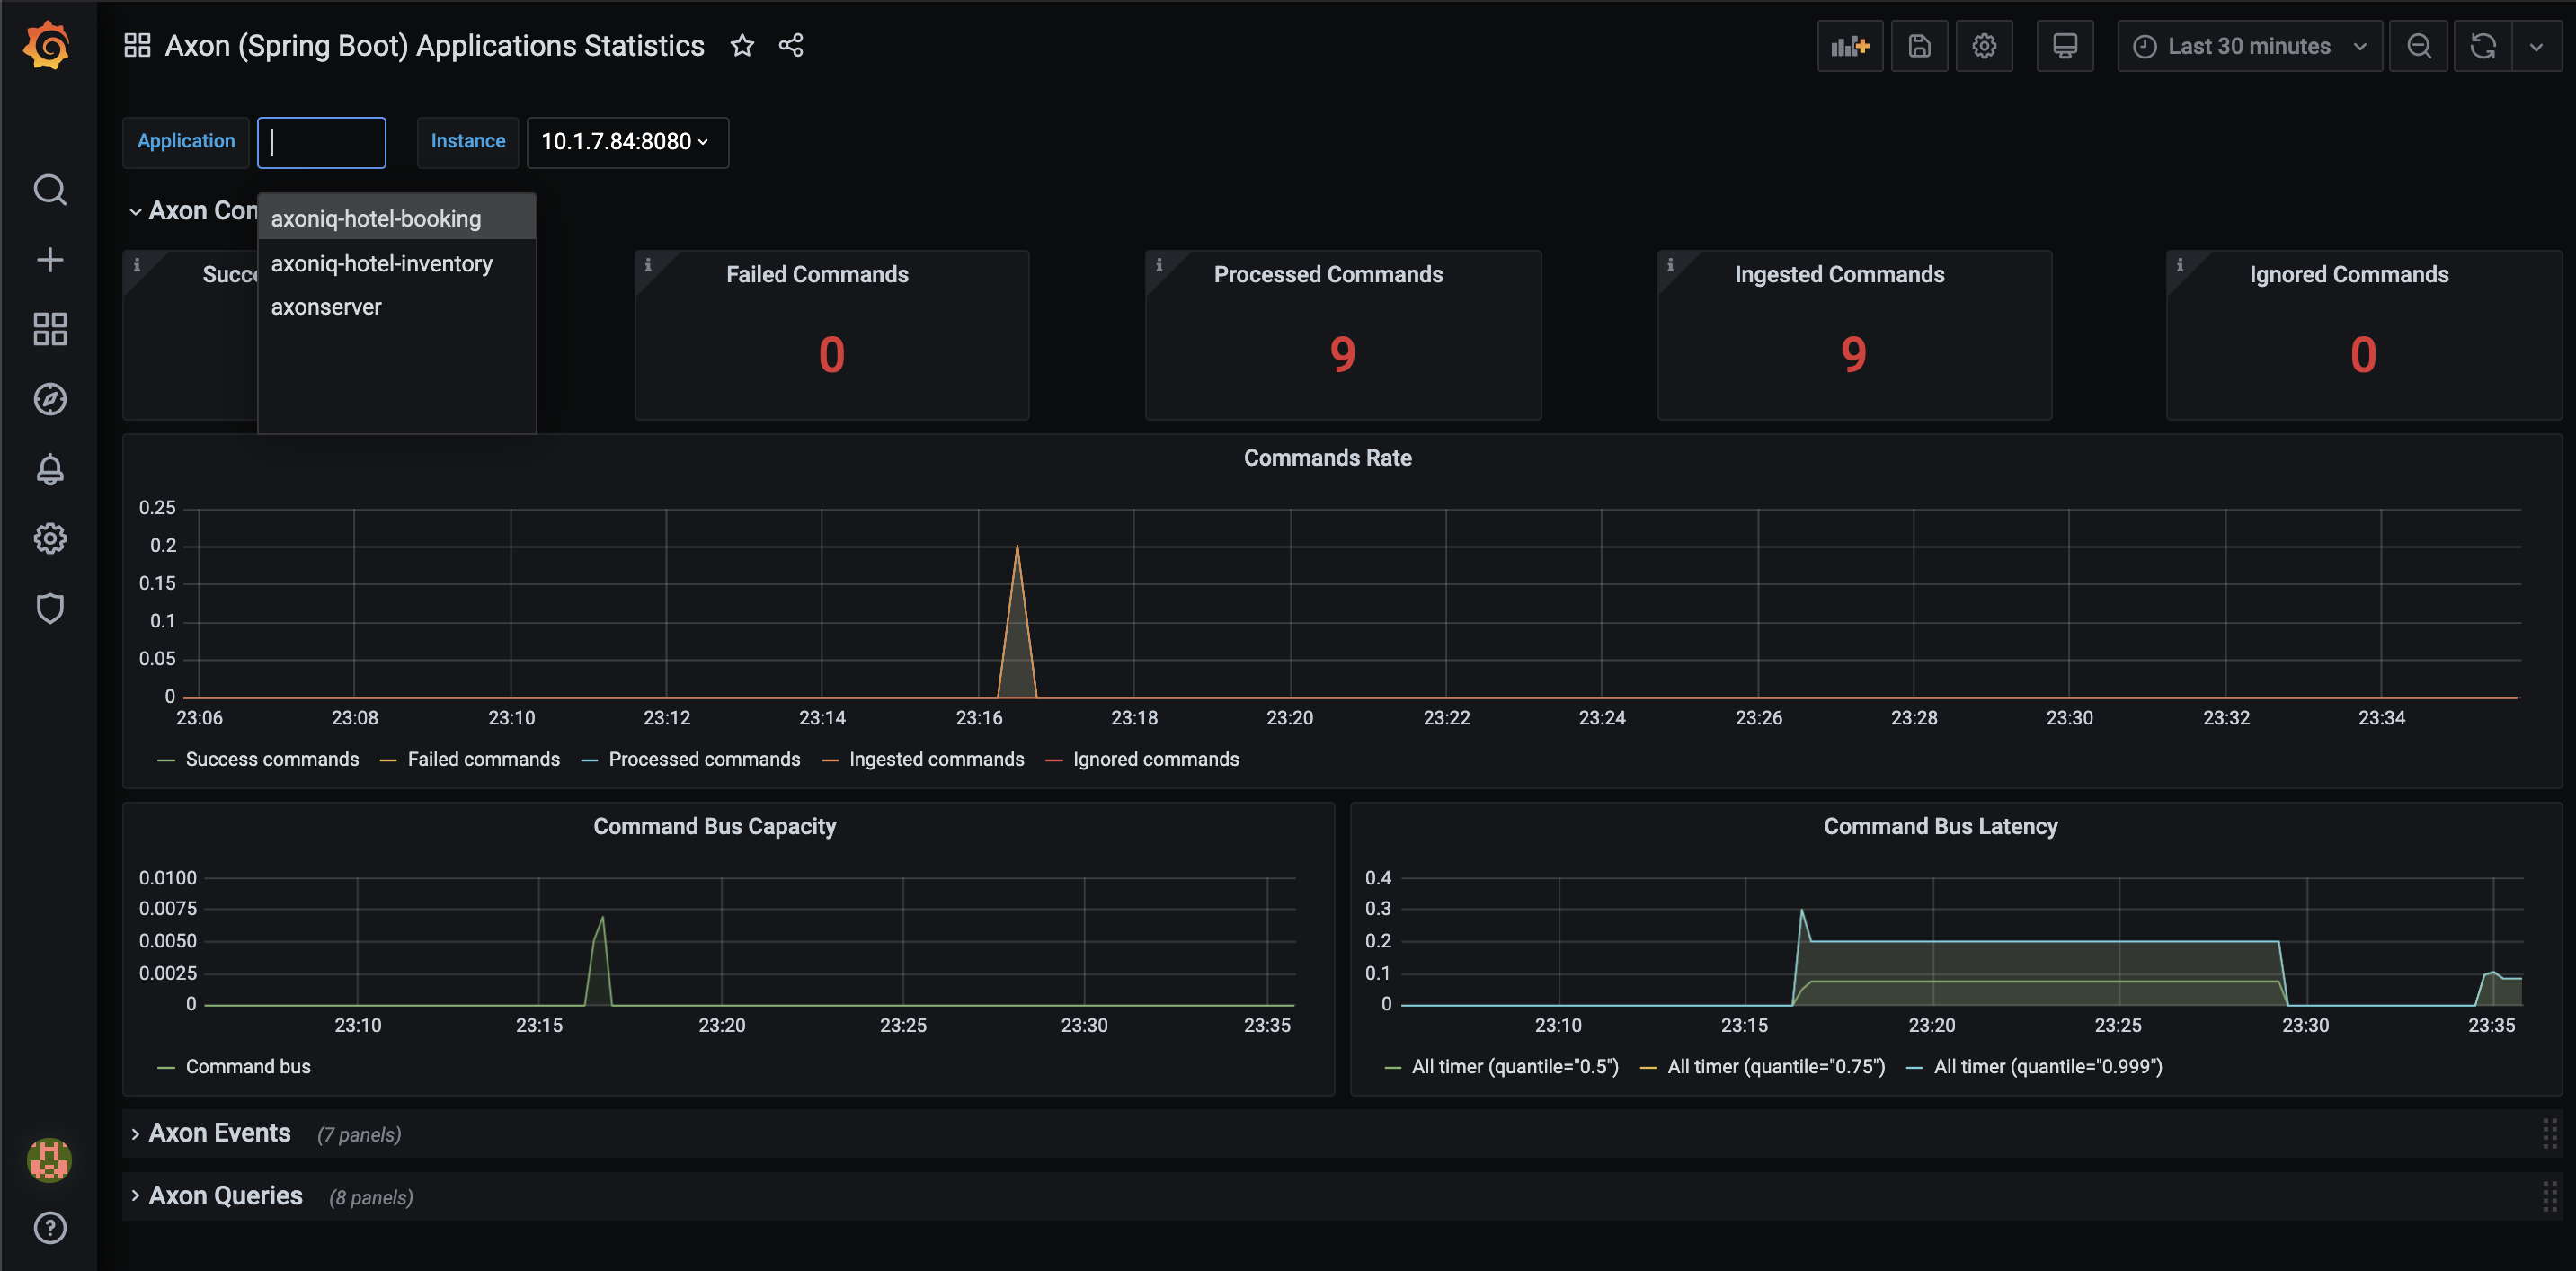
Axon Framework Application
Dashboard for Axon Framework Application (micrometer-prometheus).
With this dashboard you will get very detailed insights into metrics on many different levels: per event, eventProcessor, …
It requires the Axon application to use the axon-micrometer extension/module
https://docs.axoniq.io/reference-guide/axon-framework/monitoring-and-metrics#metrics
Additionally, micrometer tags/dimmesions could be enabled (axon.metrics.micrometer.dimensional=true) to filter out more specific metrics (per event, command type…) via labels on Grafana dashboard. The dashboard is flexible to cover both cases (with dimensions disabled as well)
Demo + webinar:
https://github.com/AxonIQ/axon-observability-demo
Created by @idugalic
Data source config
Collector config:
Upload an updated version of an exported dashboard.json file from Grafana
| Revision | Description | Created | |
|---|---|---|---|
| Download |

