
OPEN ALERTS OF ALERTMANAGER
Dashboard to visualize only Open(LIVE) Alerts of AlertManager instead of looking in Slack, Teams, and Emails.
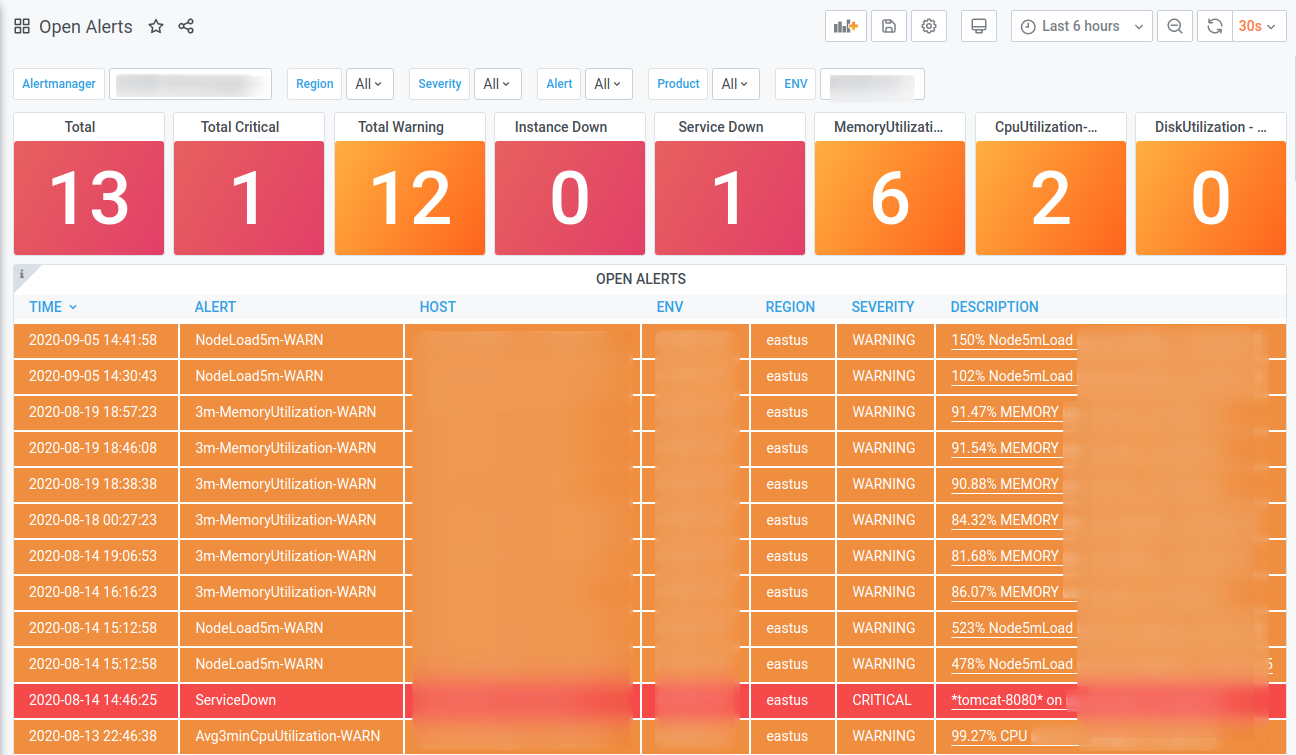
A Dashboard to visualize only Open(LIVE) Alerts of AlertManager instead of looking in Slack, Teams, and Emails.
Thanks to camptocamp organization for grafana-prometheus-alertmanager-datasource making Alertmanager behave like a datasource for Grafana.
This dashboard gives a holistic view of alerts in an organization that can be used by the Monitoring team. Also, provides drill down to one team’s environment which can be used by the on-call person of that team.
The dashboard provides filtering on the basis of
regionseverityalertteamenvironment
NOTE: Please feel free to modify these filter labels as these are very specific to my use case or remove from the query.
Email: shubhamc183@gmail.com
Data source config
Collector config:
Dashboard revisions
Upload an updated version of an exported dashboard.json file from Grafana
| Revision | Decscription | Created | |
|---|---|---|---|
| Download |
Get this dashboard
Data source:
Dependencies: