Fortigate Exporter
Graph CPU/Memory/Sessions/Interface traffic from Prometheus and the Fortigate Exporter
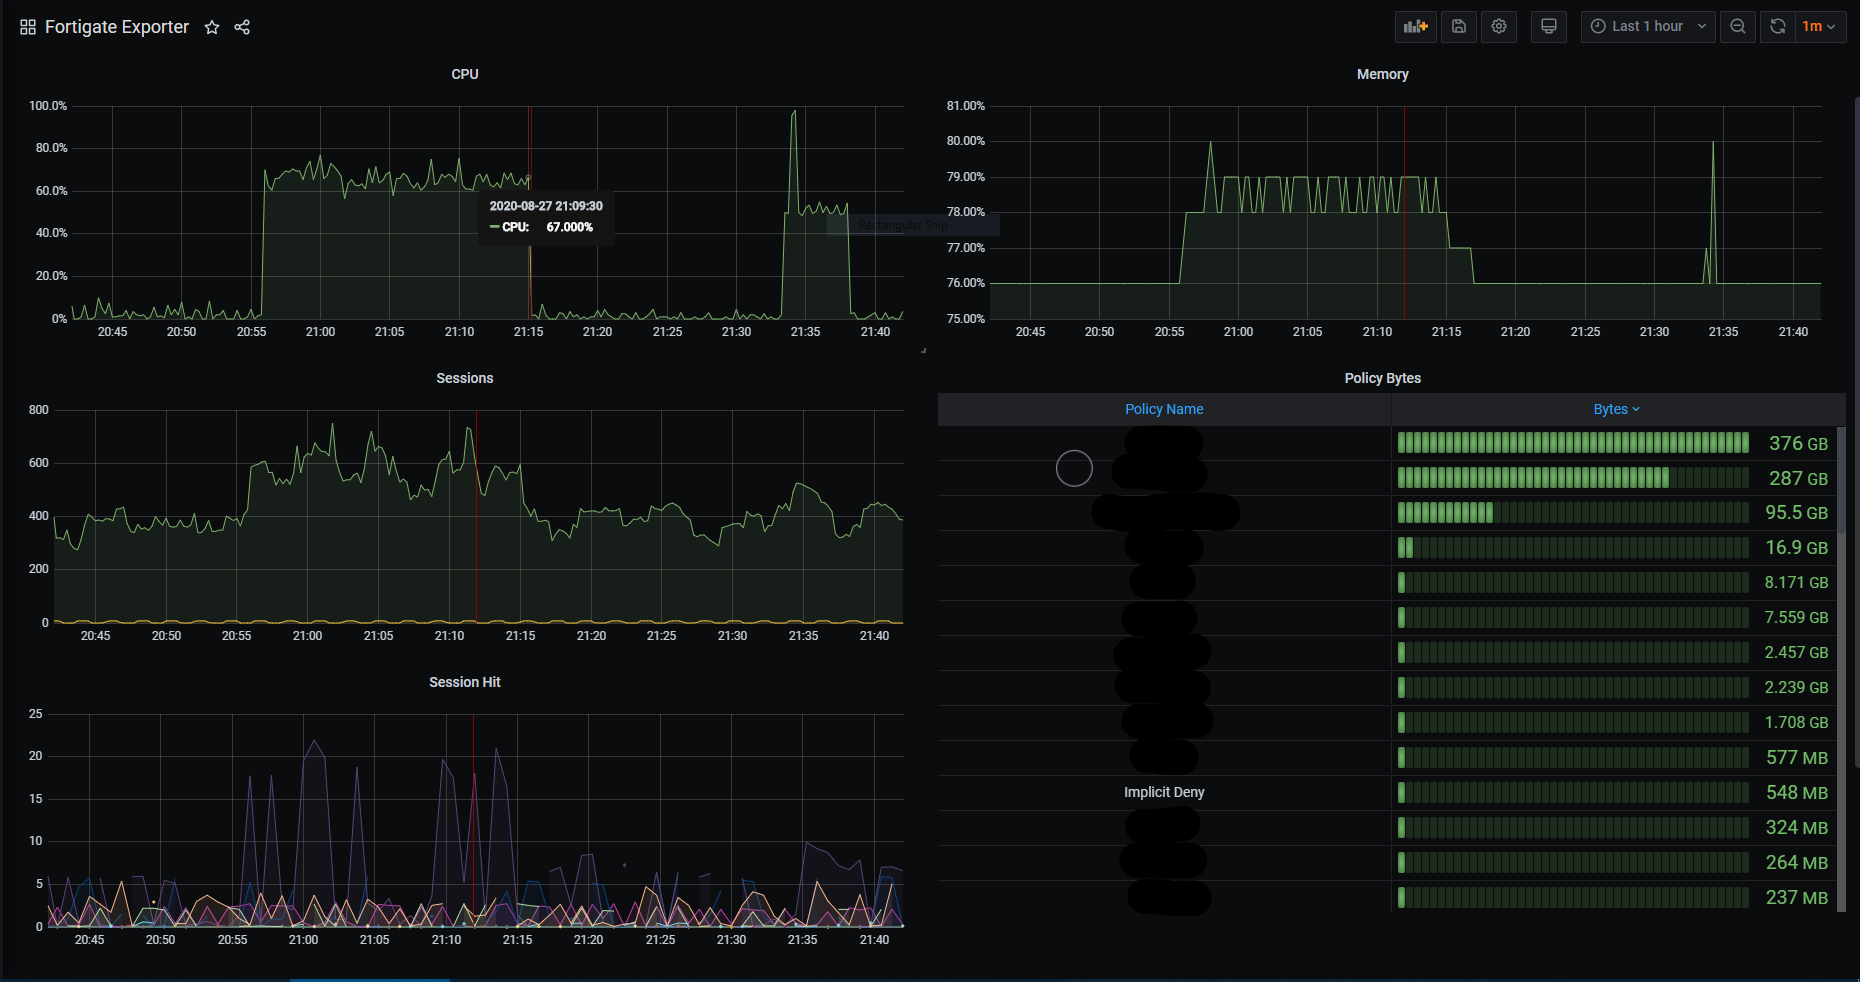
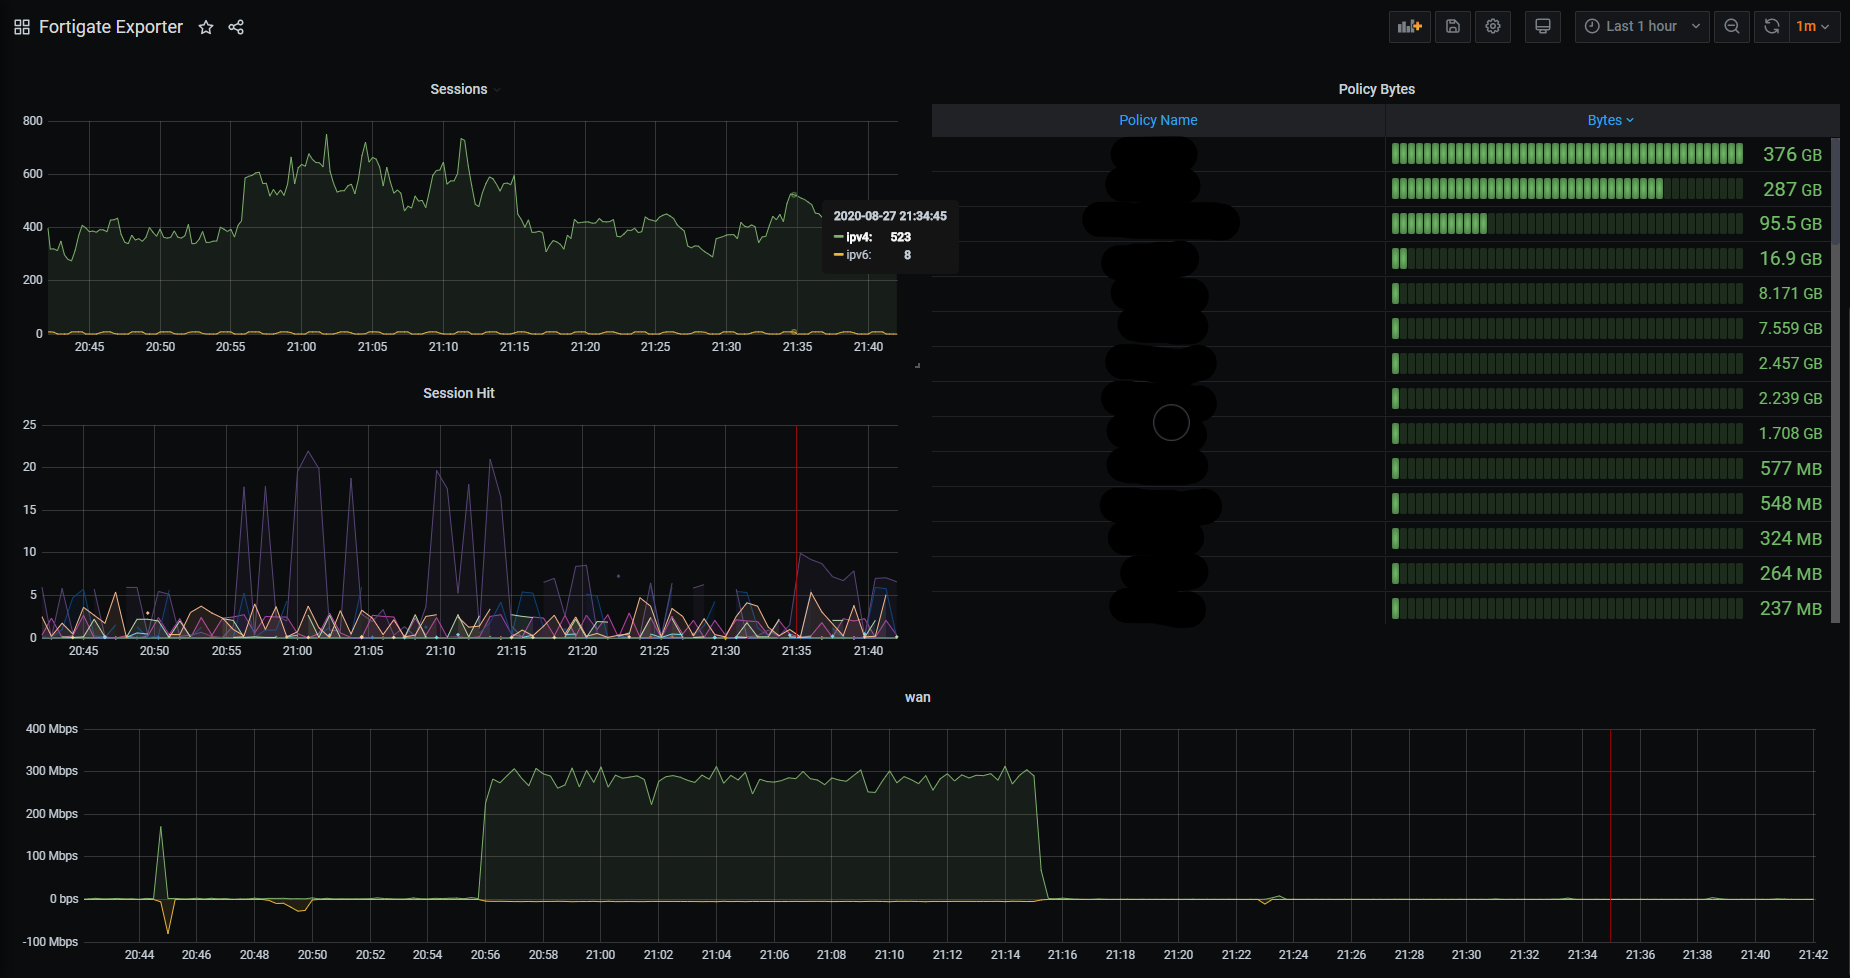
This dashboard is based on the Fortigate Prometheus exporter found at https://github.com/bluecmd/fortigate_exporter. It should be able to handle multiple instances of firewalls being scraped, and handle multi-core firewalls.
Data source config
Collector type:
Collector plugins:
Collector config:
Revisions
Upload an updated version of an exported dashboard.json file from Grafana
| Revision | Description | Created | |
|---|---|---|---|
| Download |