WSO2 Inbound Endpoint Metrics
This Dashboard provides an overview of Inbound Endpoints deployed in Enterprise Integrator Cluster.
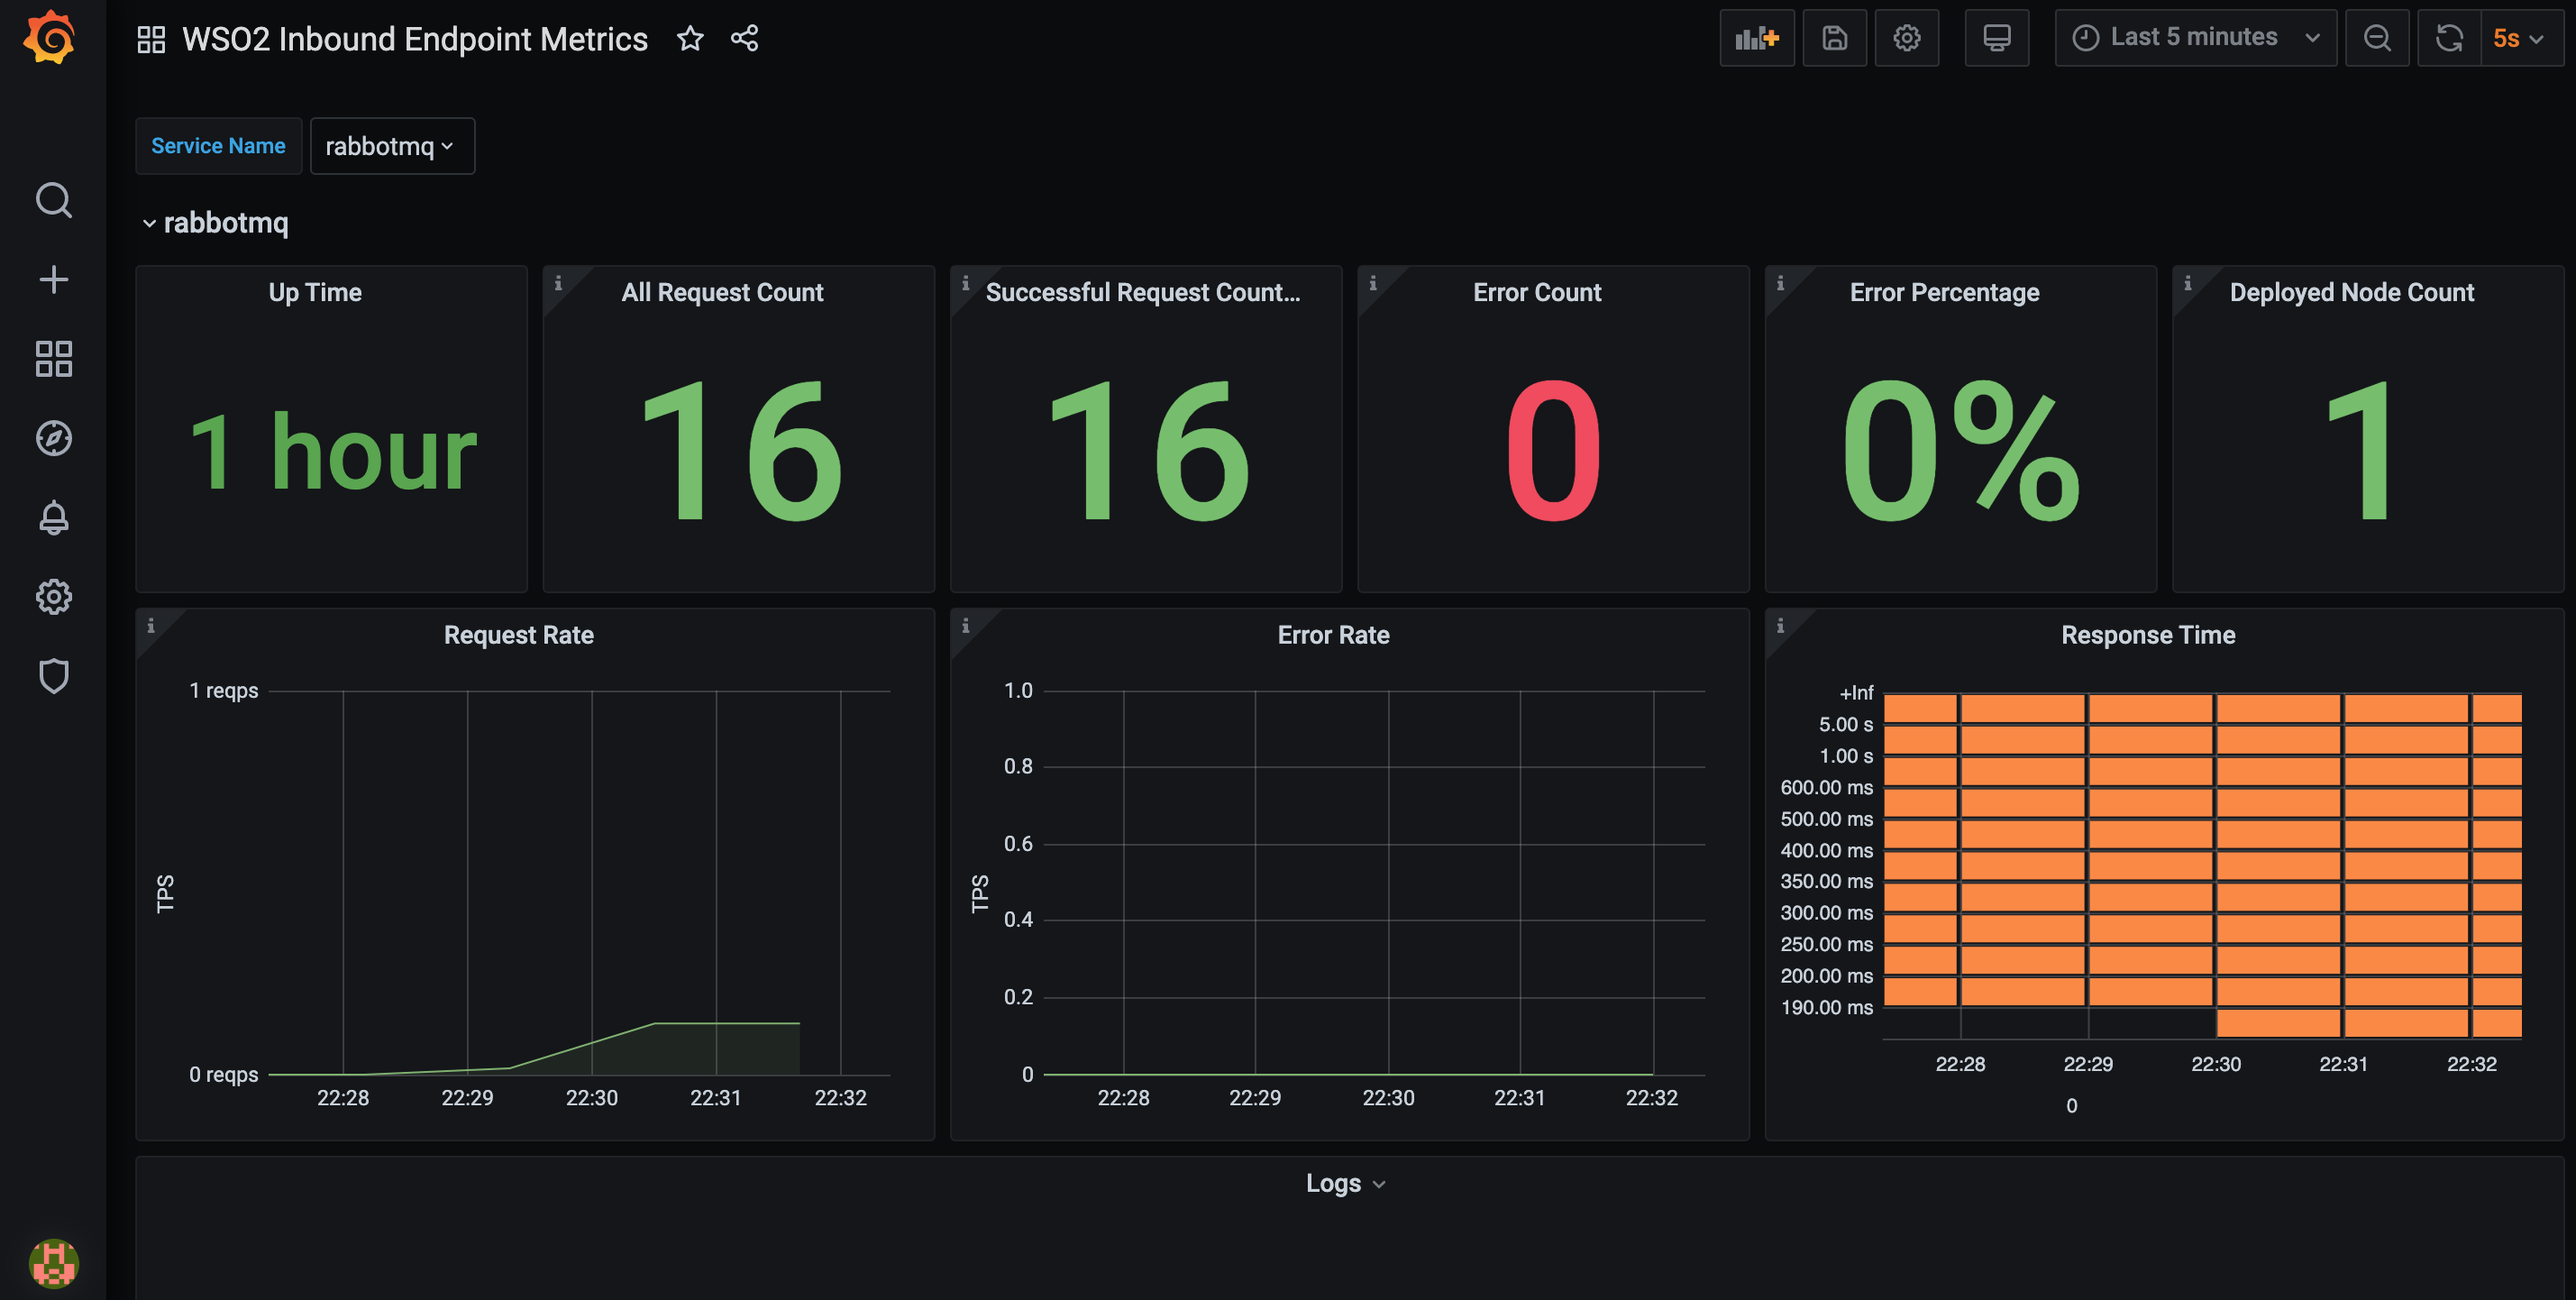
This Dashboard provides an overview of inbound endpoints deployed in Enterprise Integrator Cluster. It will have dynamic panels for each inbound endpoint deployed in Enterprise Integrator cluster and user have the ability to choose the inbound endpoint that they want to monitor using the drop down. Following stats are displayed in the inbound endpoint dashboards.
- Up Time
- All Request Count
- Successful Request Count
- Error Count
- Error Percentage
- Deployed Node Count: Number of nodes, service is deployed
- Request Rate
- Error Rate
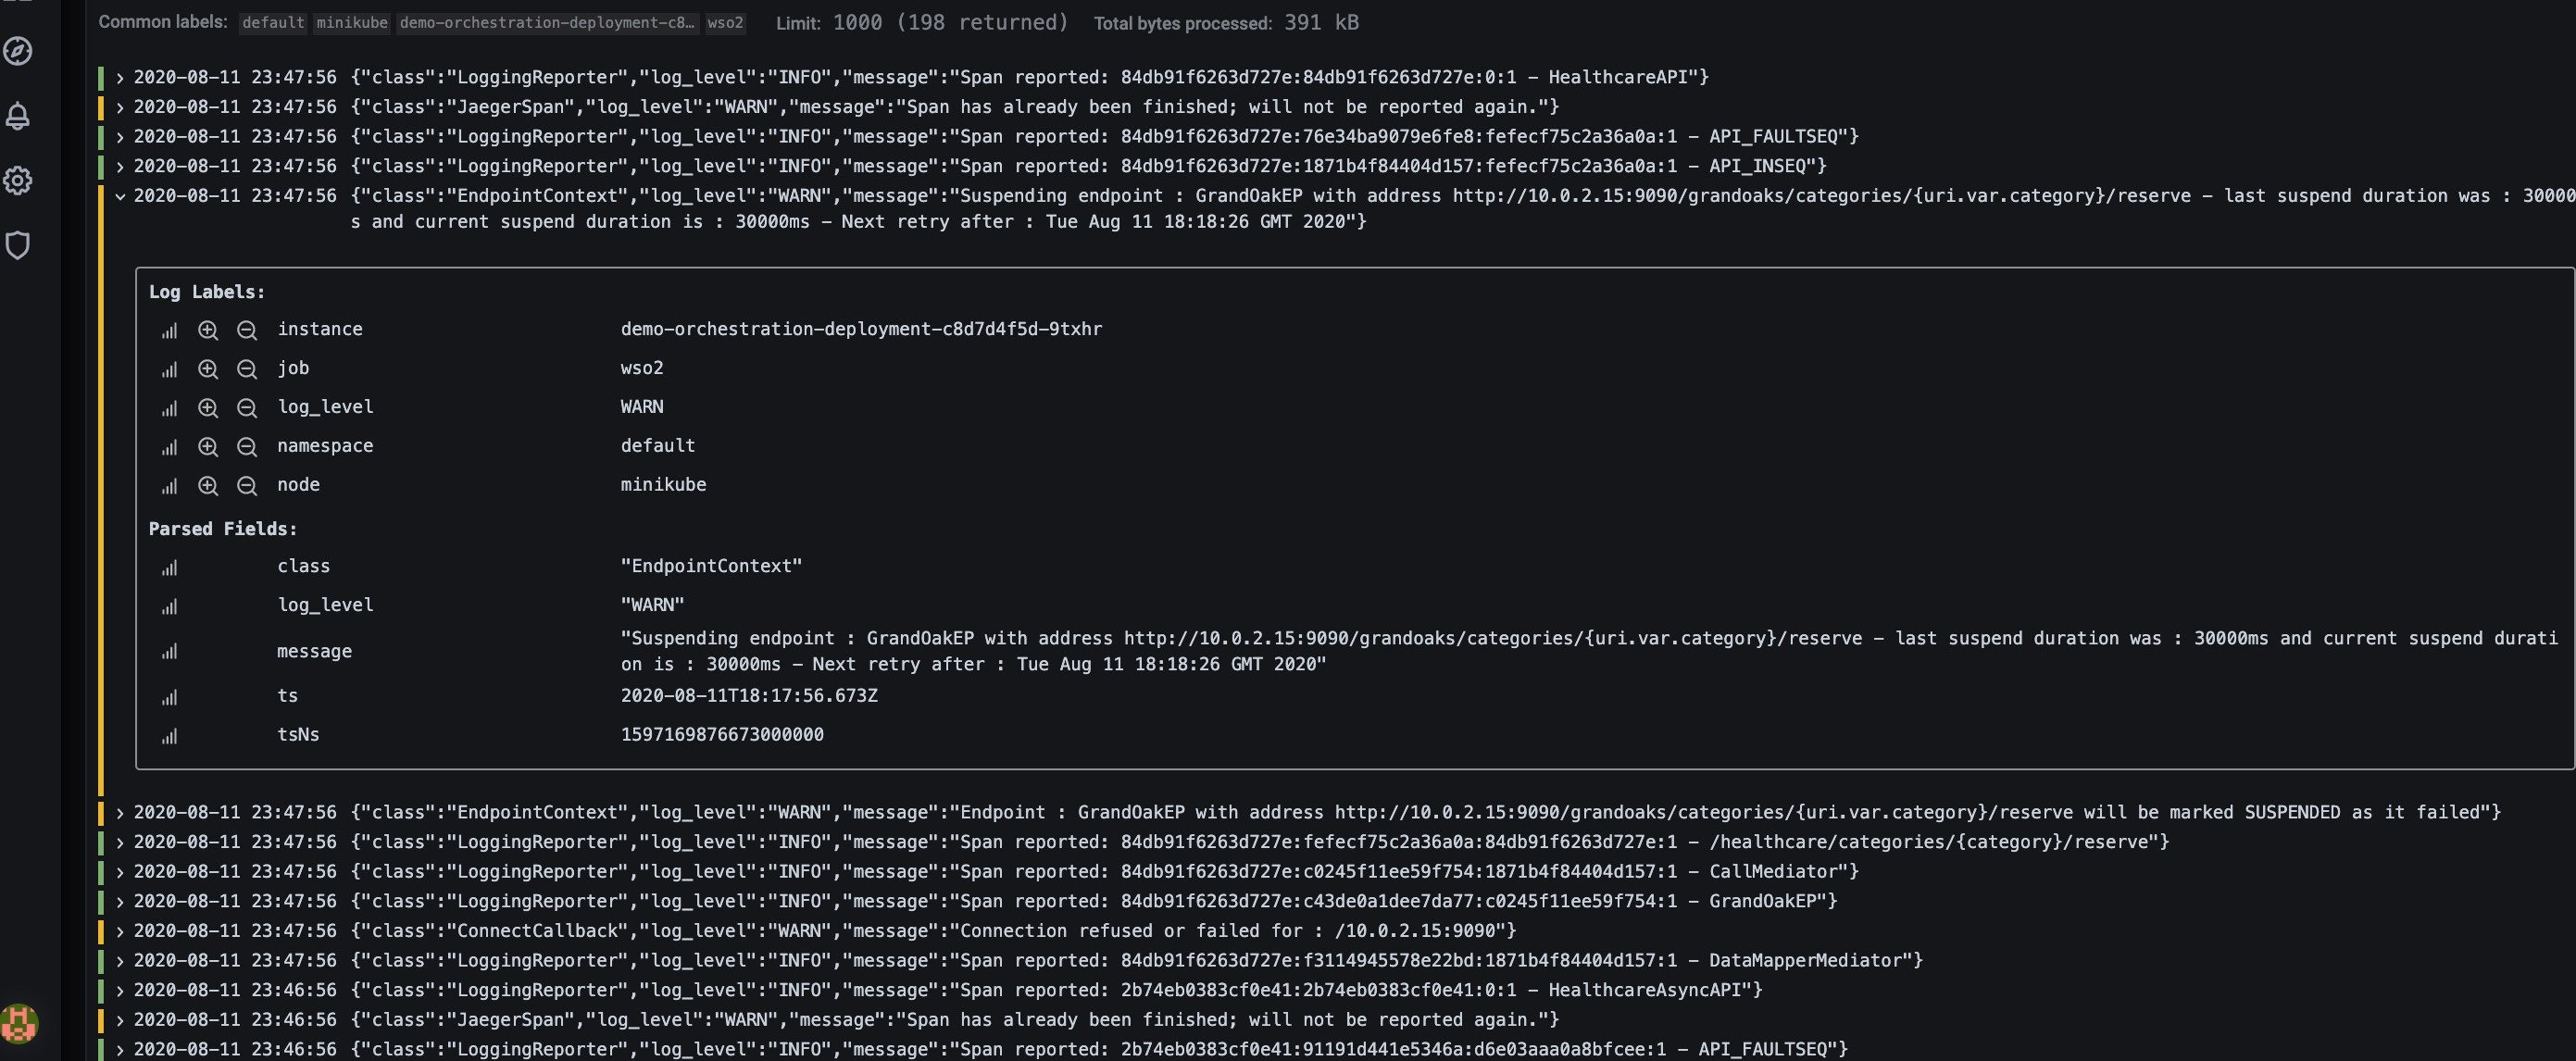
- Response Time : This will be show as a heat map using recorded histograms. If tracing is enabled widget will have a link to redirect users to Jaeger UI
Data source config
Collector type:
Collector plugins:
Collector config:
Revisions
Upload an updated version of an exported dashboard.json file from Grafana
| Revision | Description | Created | |
|---|---|---|---|
| Download |
Metrics Endpoint (Prometheus)
Easily monitor any Prometheus-compatible and publicly accessible metrics URL with Grafana Cloud's out-of-the-box monitoring solution.
Learn more