WSO2 Integration Cluster Metrics
This Dashboard provides an overview of WSO2 integration cluster deployment
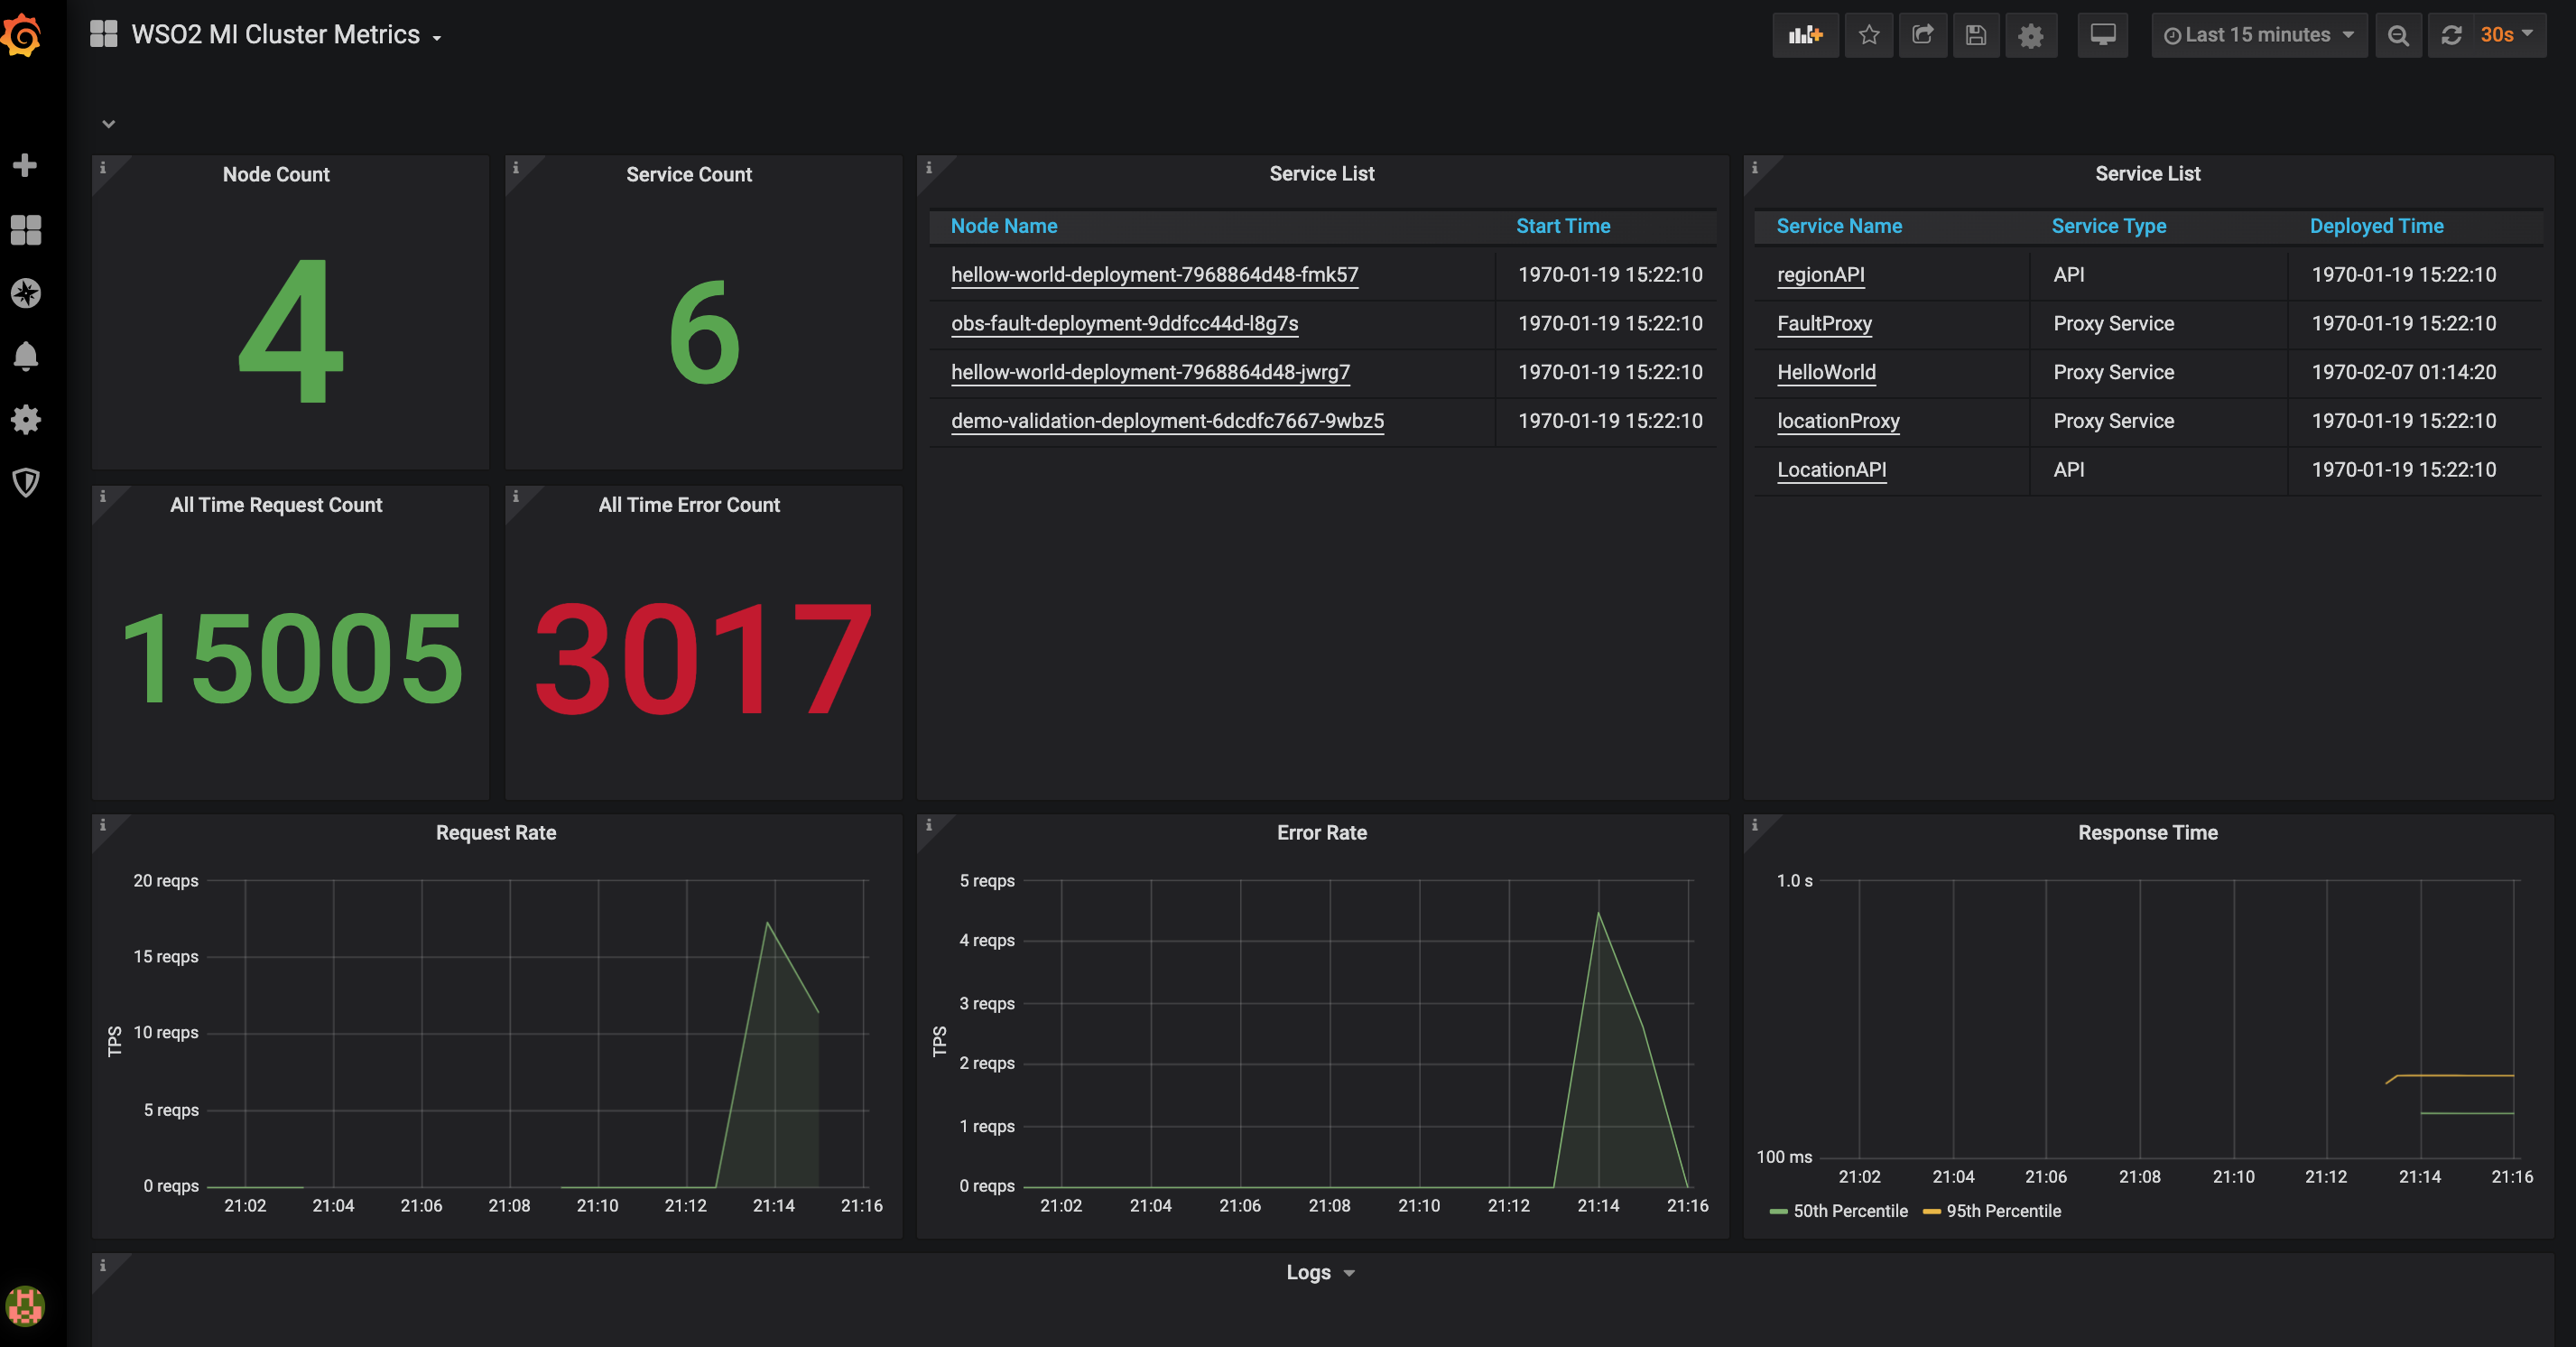
This Dashboard provides an overview of WSO2 integration cluster and works as a centralised dashboard. Dashboard will display following details about the cluster.
- Deployed node count and list
- Deployed service count and list
- Request count and rate
- Error request count and rate
- 50th and 95th percentiles of response time
- Error logs
Data source config
Collector type:
Collector plugins:
Collector config:
Revisions
Upload an updated version of an exported dashboard.json file from Grafana
| Revision | Description | Created | |
|---|---|---|---|
| Download |
WSO2 Enterprise Integrator
Easily monitor WSO2 Enterprise Integrator, a powerful configuration-driven approach to integration, with Grafana Cloud's out-of-the-box monitoring solution.
Learn more