Node exporter: mdadm status
Prometheus node_exporter mdadm module dashboard. Per Server and per md view
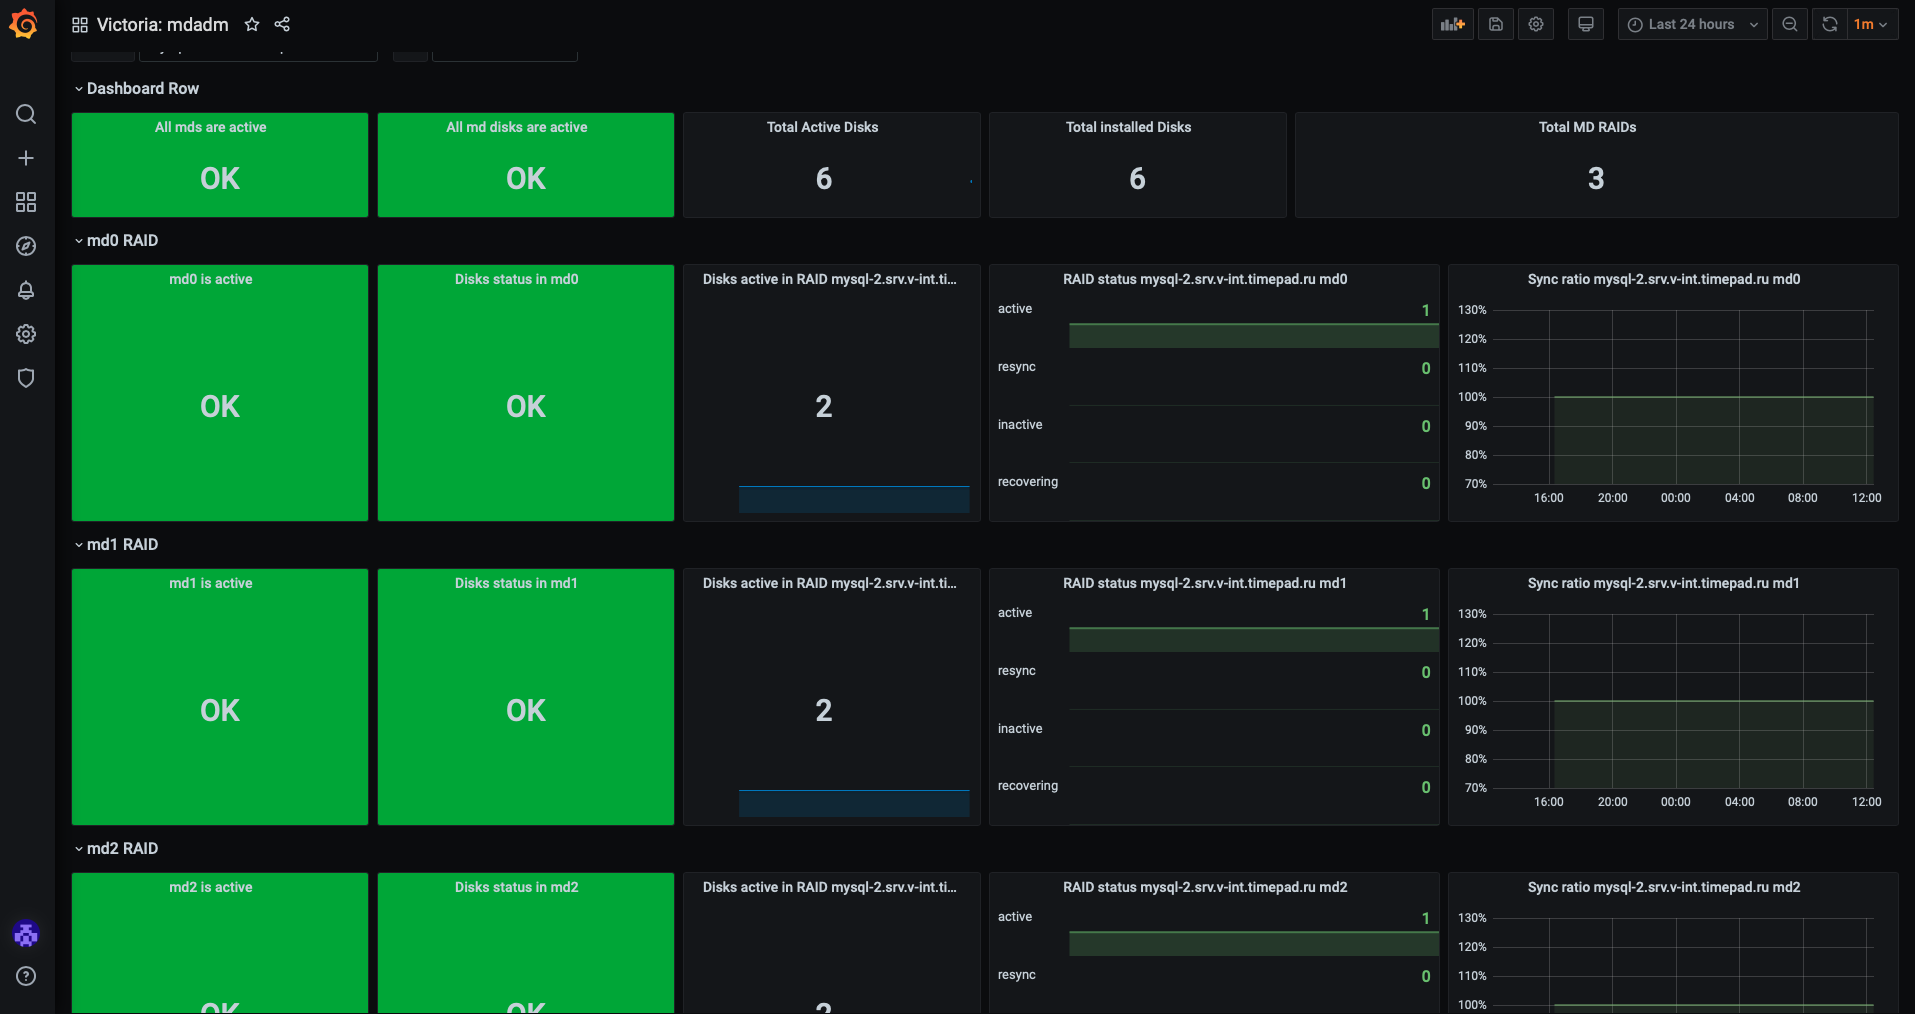
This dashboard show only mdadm status, scraped from node exporter. Dashboard adopted for node exporter v1.0.0 https://github.com/prometheus/node_exporter/releases/tag/v1.0.0 Because
node_md_disks_active is removed
node_md_disks now has a state label for "failed", "spare", "active" disks.
node_md_is_active is replaced by node_md_state with a state set of "active", "inactive", "recovering", "resync".```
Data source config
Collector type:
Collector plugins:
Collector config:
Revisions
Upload an updated version of an exported dashboard.json file from Grafana
| Revision | Description | Created | |
|---|---|---|---|
| Download |
Linux Server
Monitor Linux with Grafana. Easily monitor your Linux deployment with Grafana Cloud's out-of-the-box monitoring solution.
Learn more