HBase 1.x
Hbase 1.x using prometheus jmx eporter
About
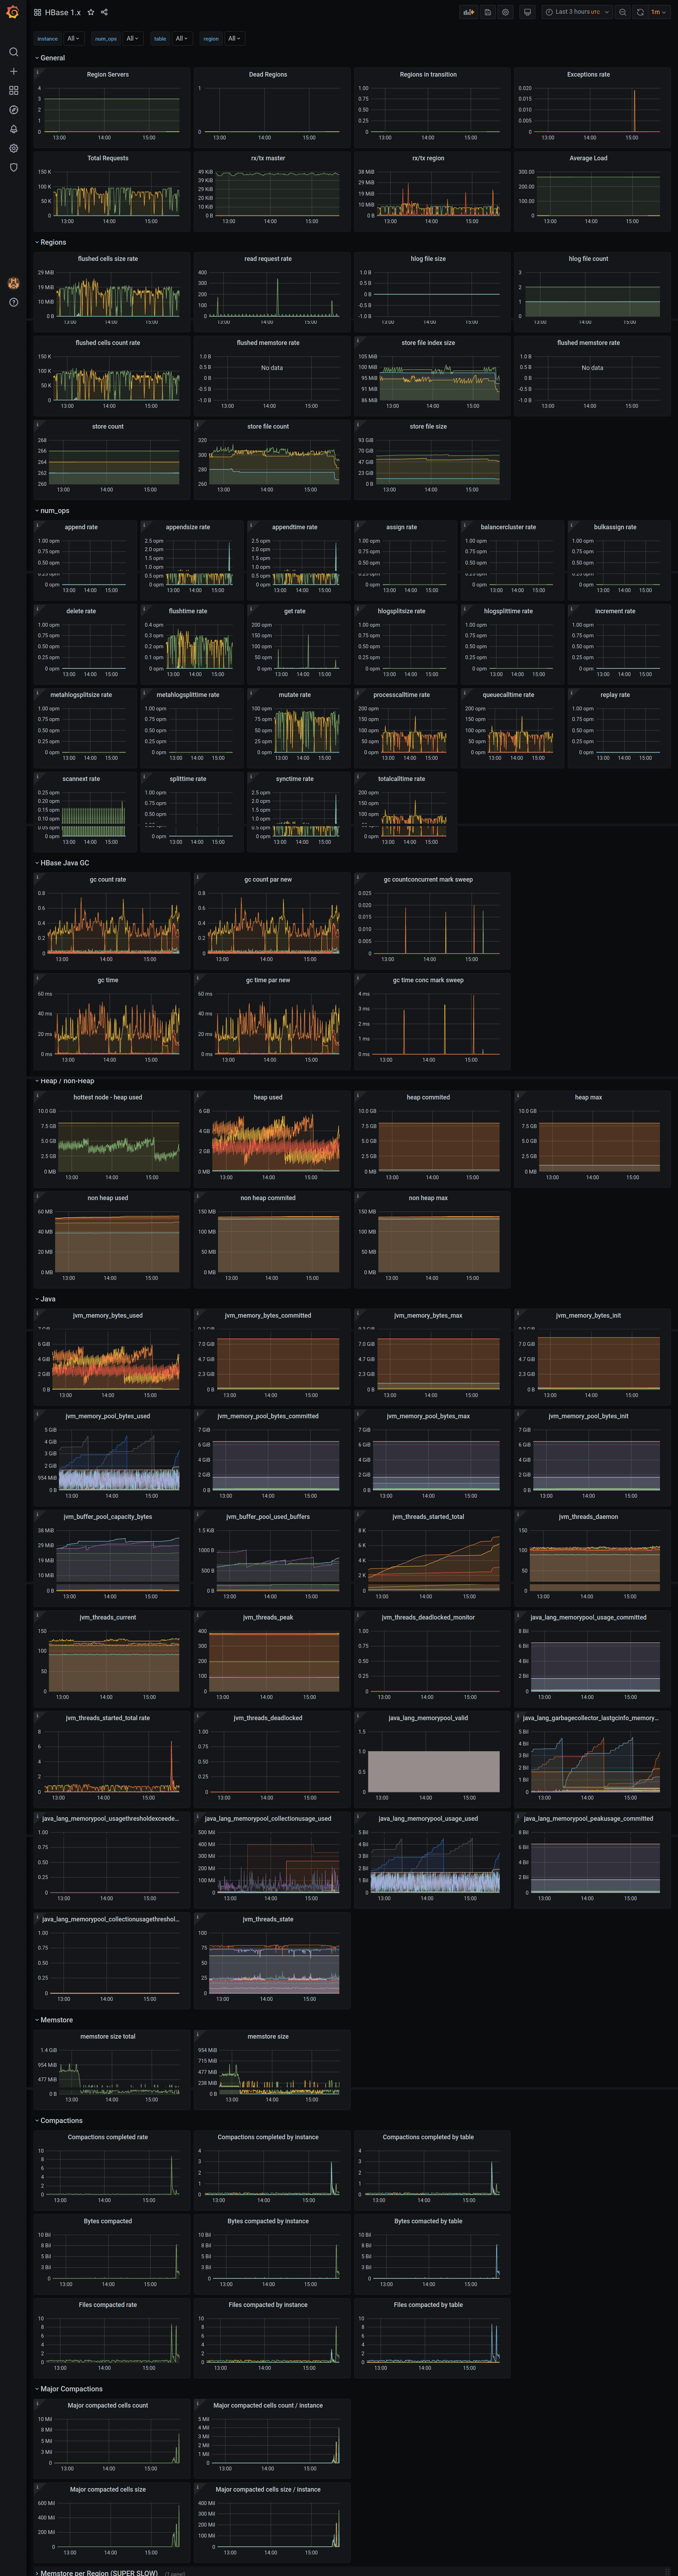
Initial test example. Not everything is rendered or usable. Some metrics are wrong, because this is quick copy/adaptation of my other dashboard used with HBase 2.x
Tested with
HBase:
- prometheus v2.19.0
- grafana v7.1.1 (3039f9c3bd)) with prometheus as Data Source
- Hadoop 2.7.1
- hbase 1.1.13 with jmx_prometheus_javaagent-0.13.1-SNAPSHOT.jar (just download form github and compile it on your own)
HBase Master HBASE_OPTS appended:
-javaagent:/data/jmx_exporter/jmx_prometheus_javaagent-0.13.1-SNAPSHOT.jar=0.0.0.0:26010:/data/jmx_exporter/jmx_hbase.yaml
HBase Regionserver HBASE_OPTS appended:
-javaagent:/data/jmx_exporter/jmx_prometheus_javaagent-0.13.1-SNAPSHOT.jar=0.0.0.0:26030:/data/jmx_exporter/jmx_hbase.yaml
- jmx-prometheus config
/data/jmx_exporter/jmx_hbase.yaml:
---
lowercaseOutputName: true
lowercaseOutputLabelNames: true
rules:
- pattern: Hadoop<service=HBase, name=RegionServer, sub=Regions><>Namespace_([^\W_]+)_table_([^\W_]+)_region_([^\W_]+)_metric_(\w+)
  name: HBase_metric_$4
  labels:
    namespace: "$1"
    table: "$2"
    region: "$3"
- pattern: Hadoop<service=(\w+), name=(\w+), sub=(\w+)><>([\w._]+)
  name: hadoop_$1_$4
  labels:
    "name": "$2"
    "sub": "$3"
- pattern: .+
- prometheus scrape targets:
# two hbase masters
  - targets:
    - m-1:26010
    - m-2:26010
    labels:
      type: master
# three hbase regionservers
  - targets:
    - m-1:26030
    - m-2:26030
    - m-3:26030
    labels:
      type: regionserver
Known limitations
- some metrics are empty because they are remnants from HBase 2.x and they just don't exist (I was lazy)
- You may need to adjust dashboard to match your prometheus labels
- Vast majority of metrics is not yet exposed on the graphs, but you can add them on your own
- Some metrics are duplicated because the way they are exposed by jmx_exporter
Changelog
- Initial release
Contact
- contact author if you have any suggestions etc
Data source config
Collector type:
Collector plugins:
Collector config:
Revisions
Upload an updated version of an exported dashboard.json file from Grafana
| Revision | Description | Created | |
|---|---|---|---|
| Download |
Apache HBase
Easily monitor Apache HBase, an open source non-relational distributed database, with Grafana Cloud's out-of-the-box monitoring solution.
Learn more