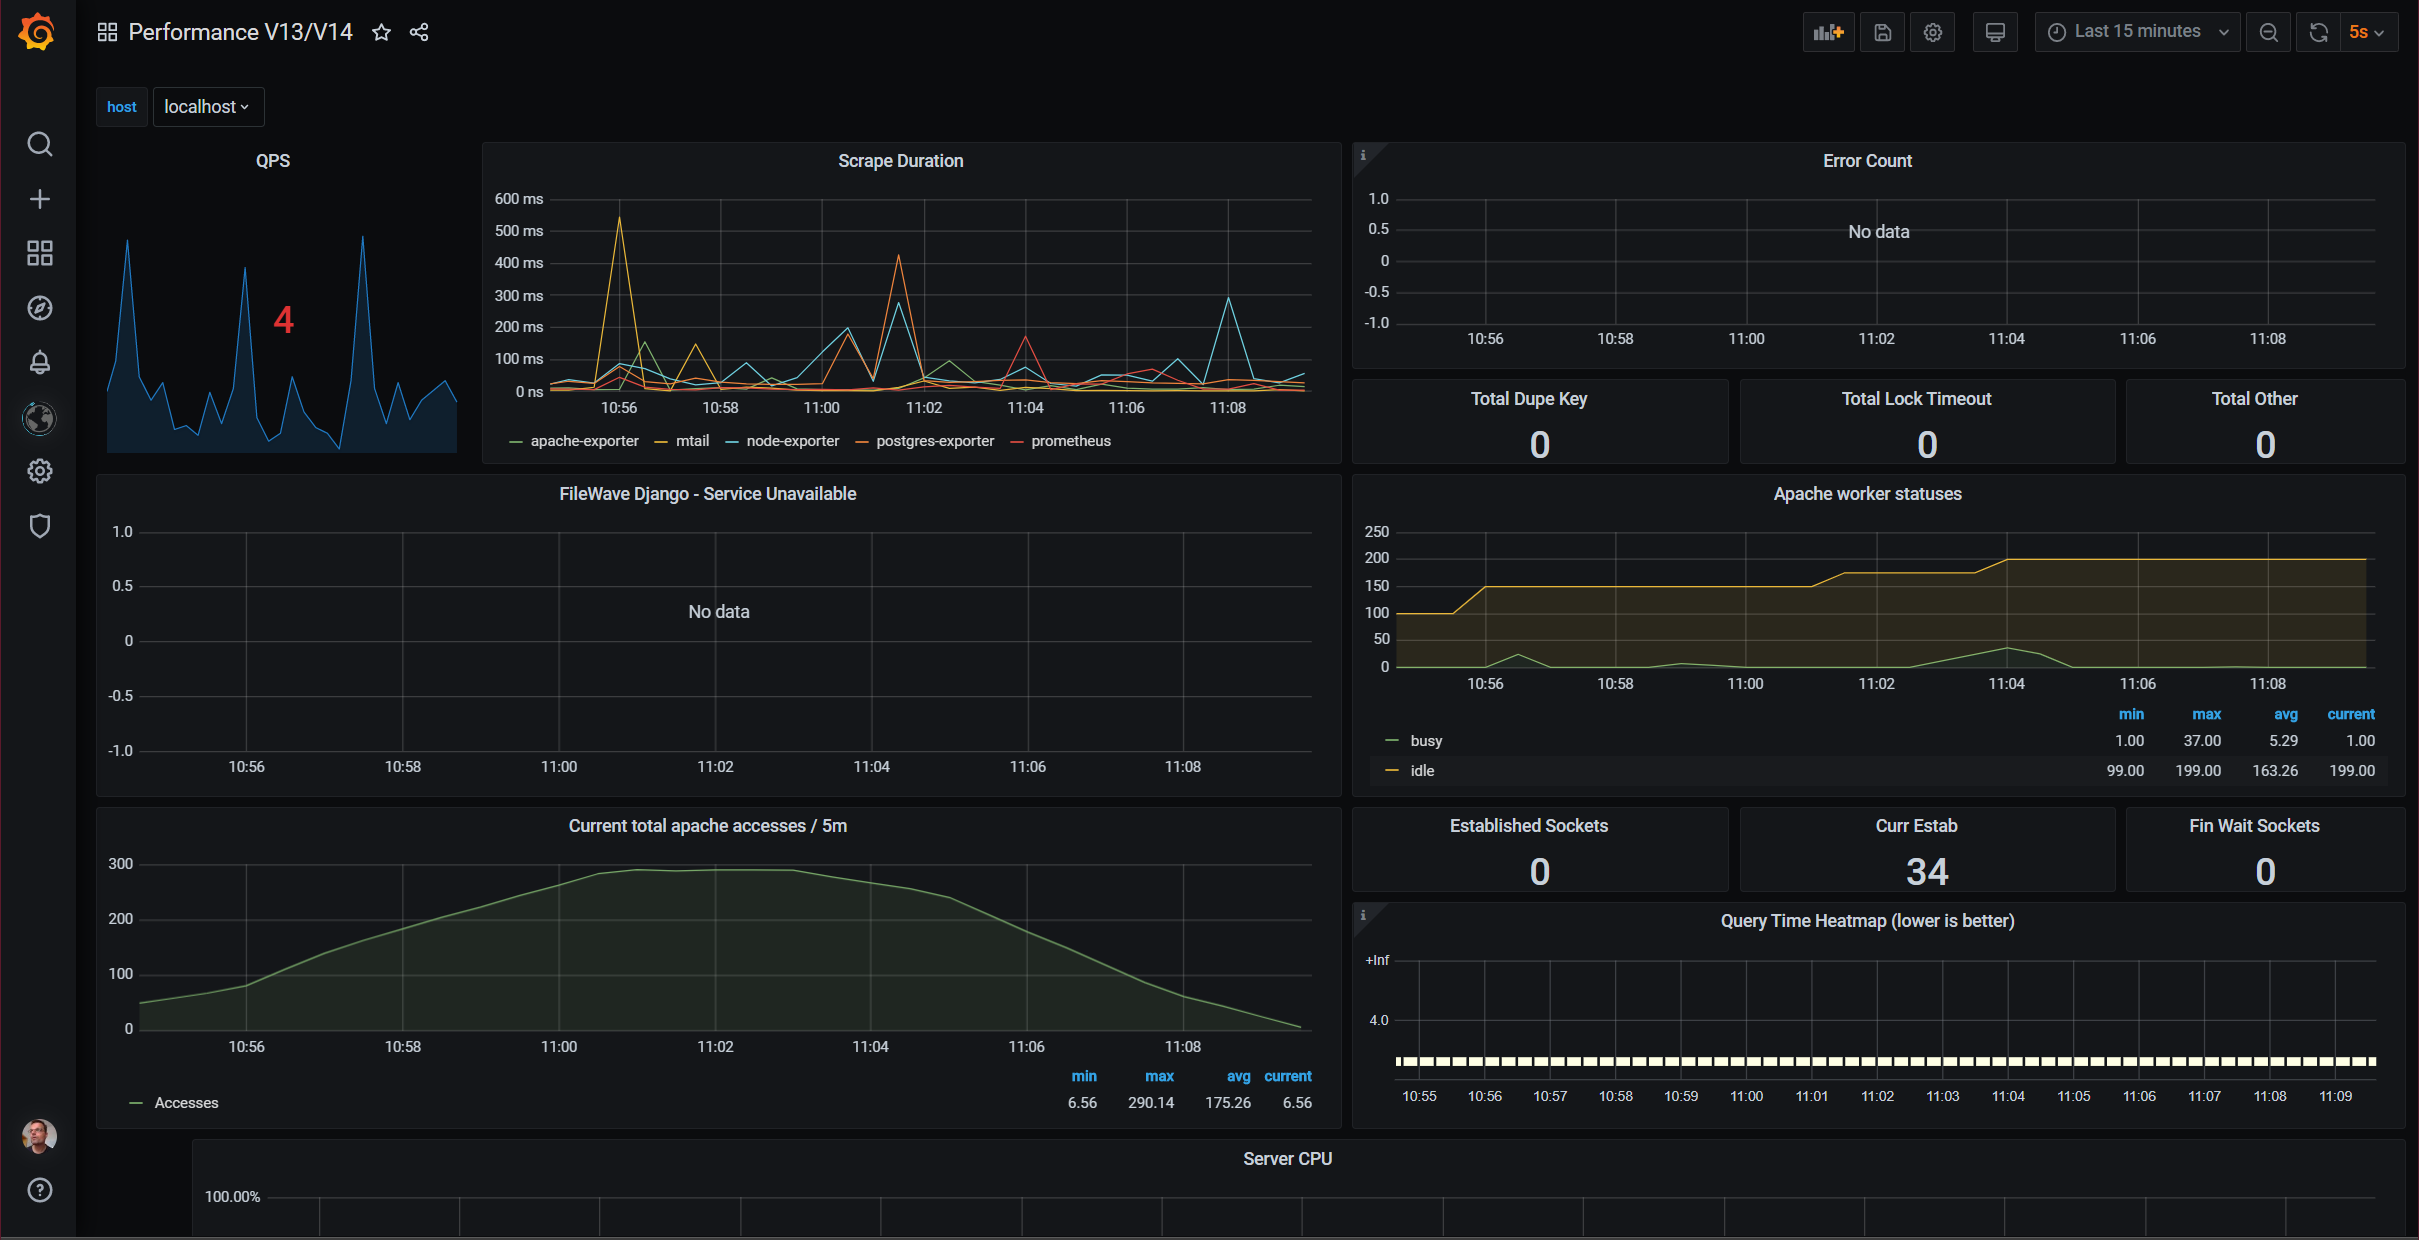
Performance V13/V14
A performance measurement dashboard for use with v13/v14 of FileWave.
The dashboard shows information from postgres, apache and the host that FileWave is running on. This is used to help us understand the performance profile of a filewave server under different load situations.
To use this on a v13 system: please visit https://pypi.org/project/filewave-monitor-v13/ and follow the instructions there.
To use this on a v14 system: just load this dashboard directly into the Grafana system that's embedded in v14.
Data source config
Collector config:
Upload an updated version of an exported dashboard.json file from Grafana
| Revision | Description | Created | |
|---|---|---|---|
| Download |

