
Azure Windows Virtual Desktop Overview
A sample dashboard that pulls in multiple data sources from Azure that all relate to Windows Virtual Desktop Instances.
This is a work in progress dashboard created for monitoring the Azure Windows Virtual Desktop service. It is meant to collect data from Azure Monitor, Azure Log Analytics, and influxDB. It works best if you are deploying your WVD Instances in a Scale Set.
Required Setup
- Grafana deployed with a functional connection to Azure Monitor and Azure Log Analytics data sources.
- InfluxDB (for storing session count)
- Diag Data Export setup for Azure WVD Service
Features:
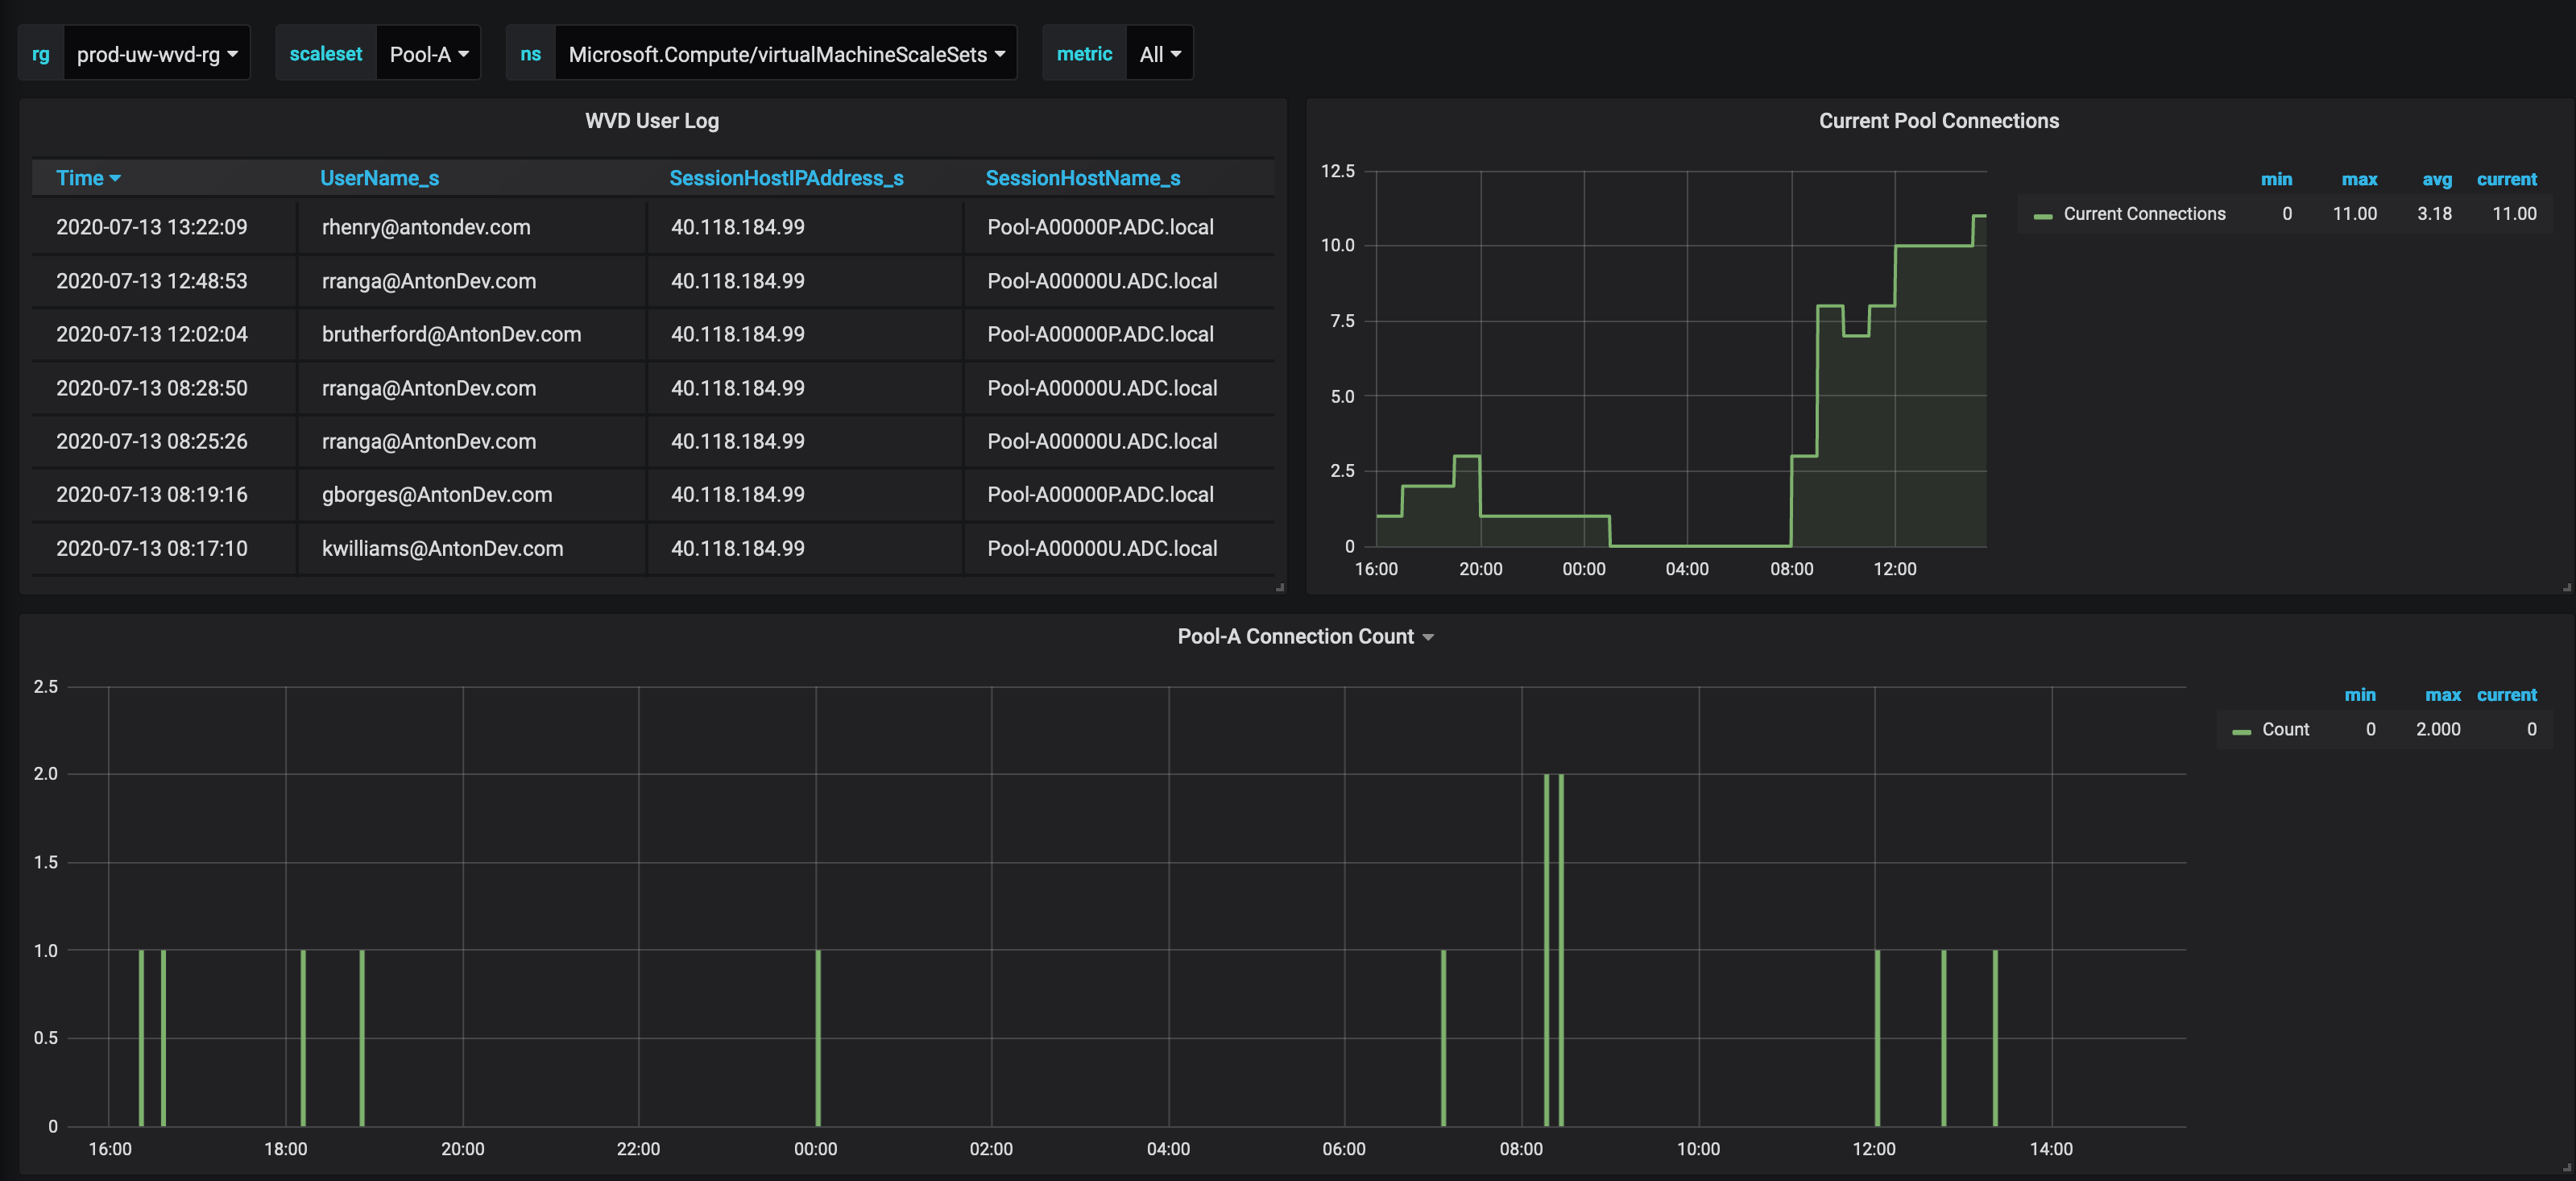
- Table log of active users in the time period specified. This is based on Log Analytic quereies.
- Connection count per host pool based on Log Analytics generated by the WVD Service.
- Current active user count by host pool (Generated by Powershell script below)
- https://github.com/nshores/azure_wvd_monitor/blob/master/rds_session_monitor.ps1
- This should be run as a Azure Automation job in a playbook.
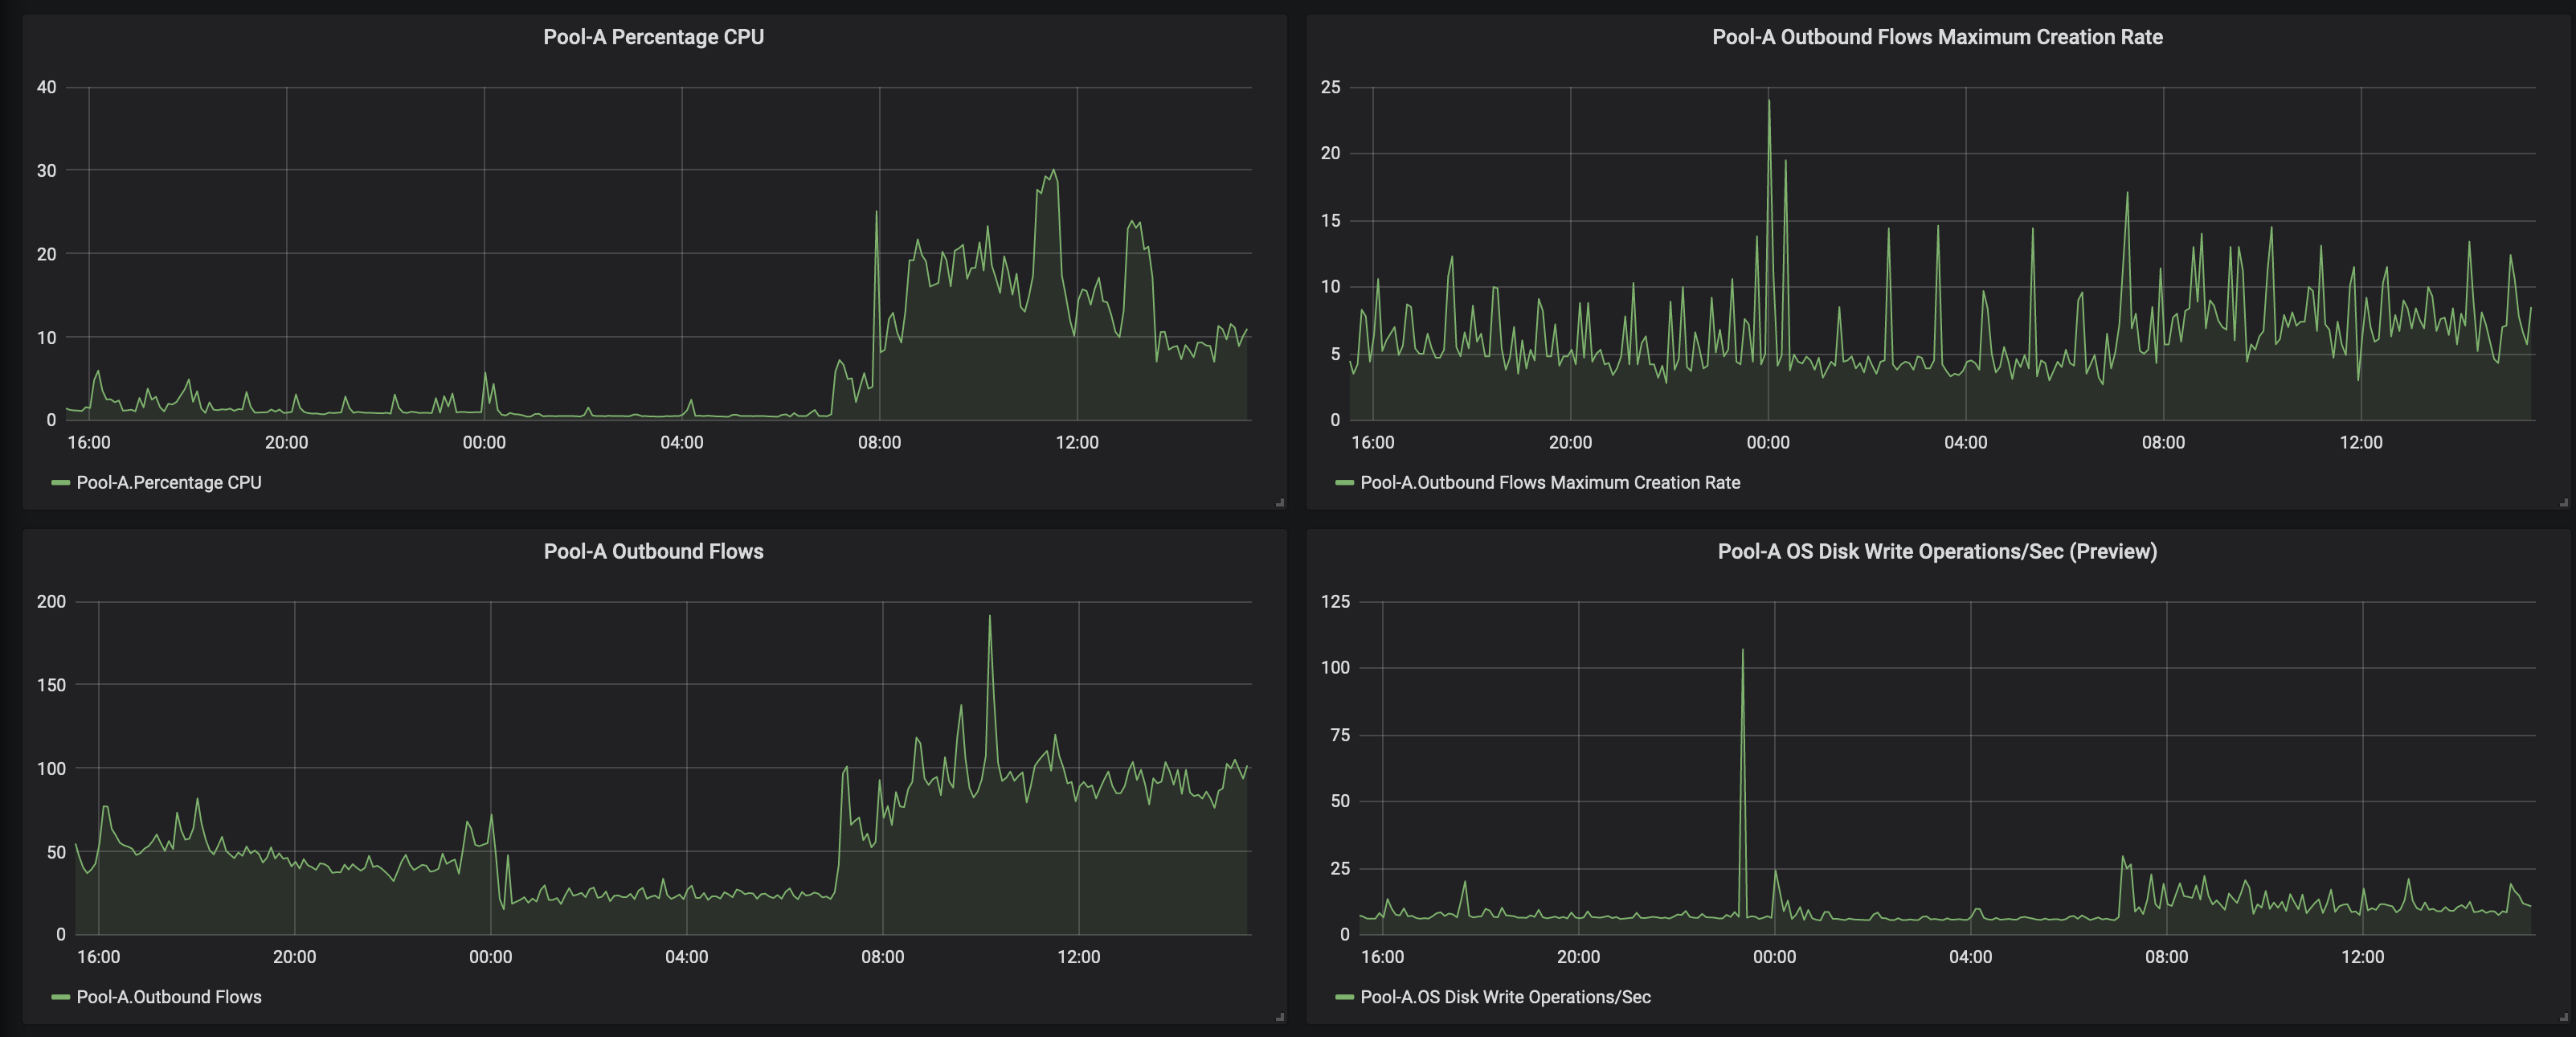
- Template Panels that pull all currently available Azure Monitor statistics for the selected scale set.
WIP Features:
- Modifying rds_session_monitor script to pull in more stats about current sessions, and creating associated panels.
- Creating panel to show offline vs online instances in current scale set.
Data source config
Collector type:
Collector plugins:
Collector config:
Dashboard revisions
Upload an updated version of an exported dashboard.json file from Grafana
| Revision | Decscription | Created | |
|---|---|---|---|
| Download |
Sign up for Grafana Cloud

Get up and running in minutes with the Grafana Cloud free tier, which includes free forever 10k metrics, 50GB logs, 50GB traces, 500 VUh, and more.
Get this dashboard
Data source:
Dependencies: