MySQL Query Performance Troubleshooting (Designed for PMM2)
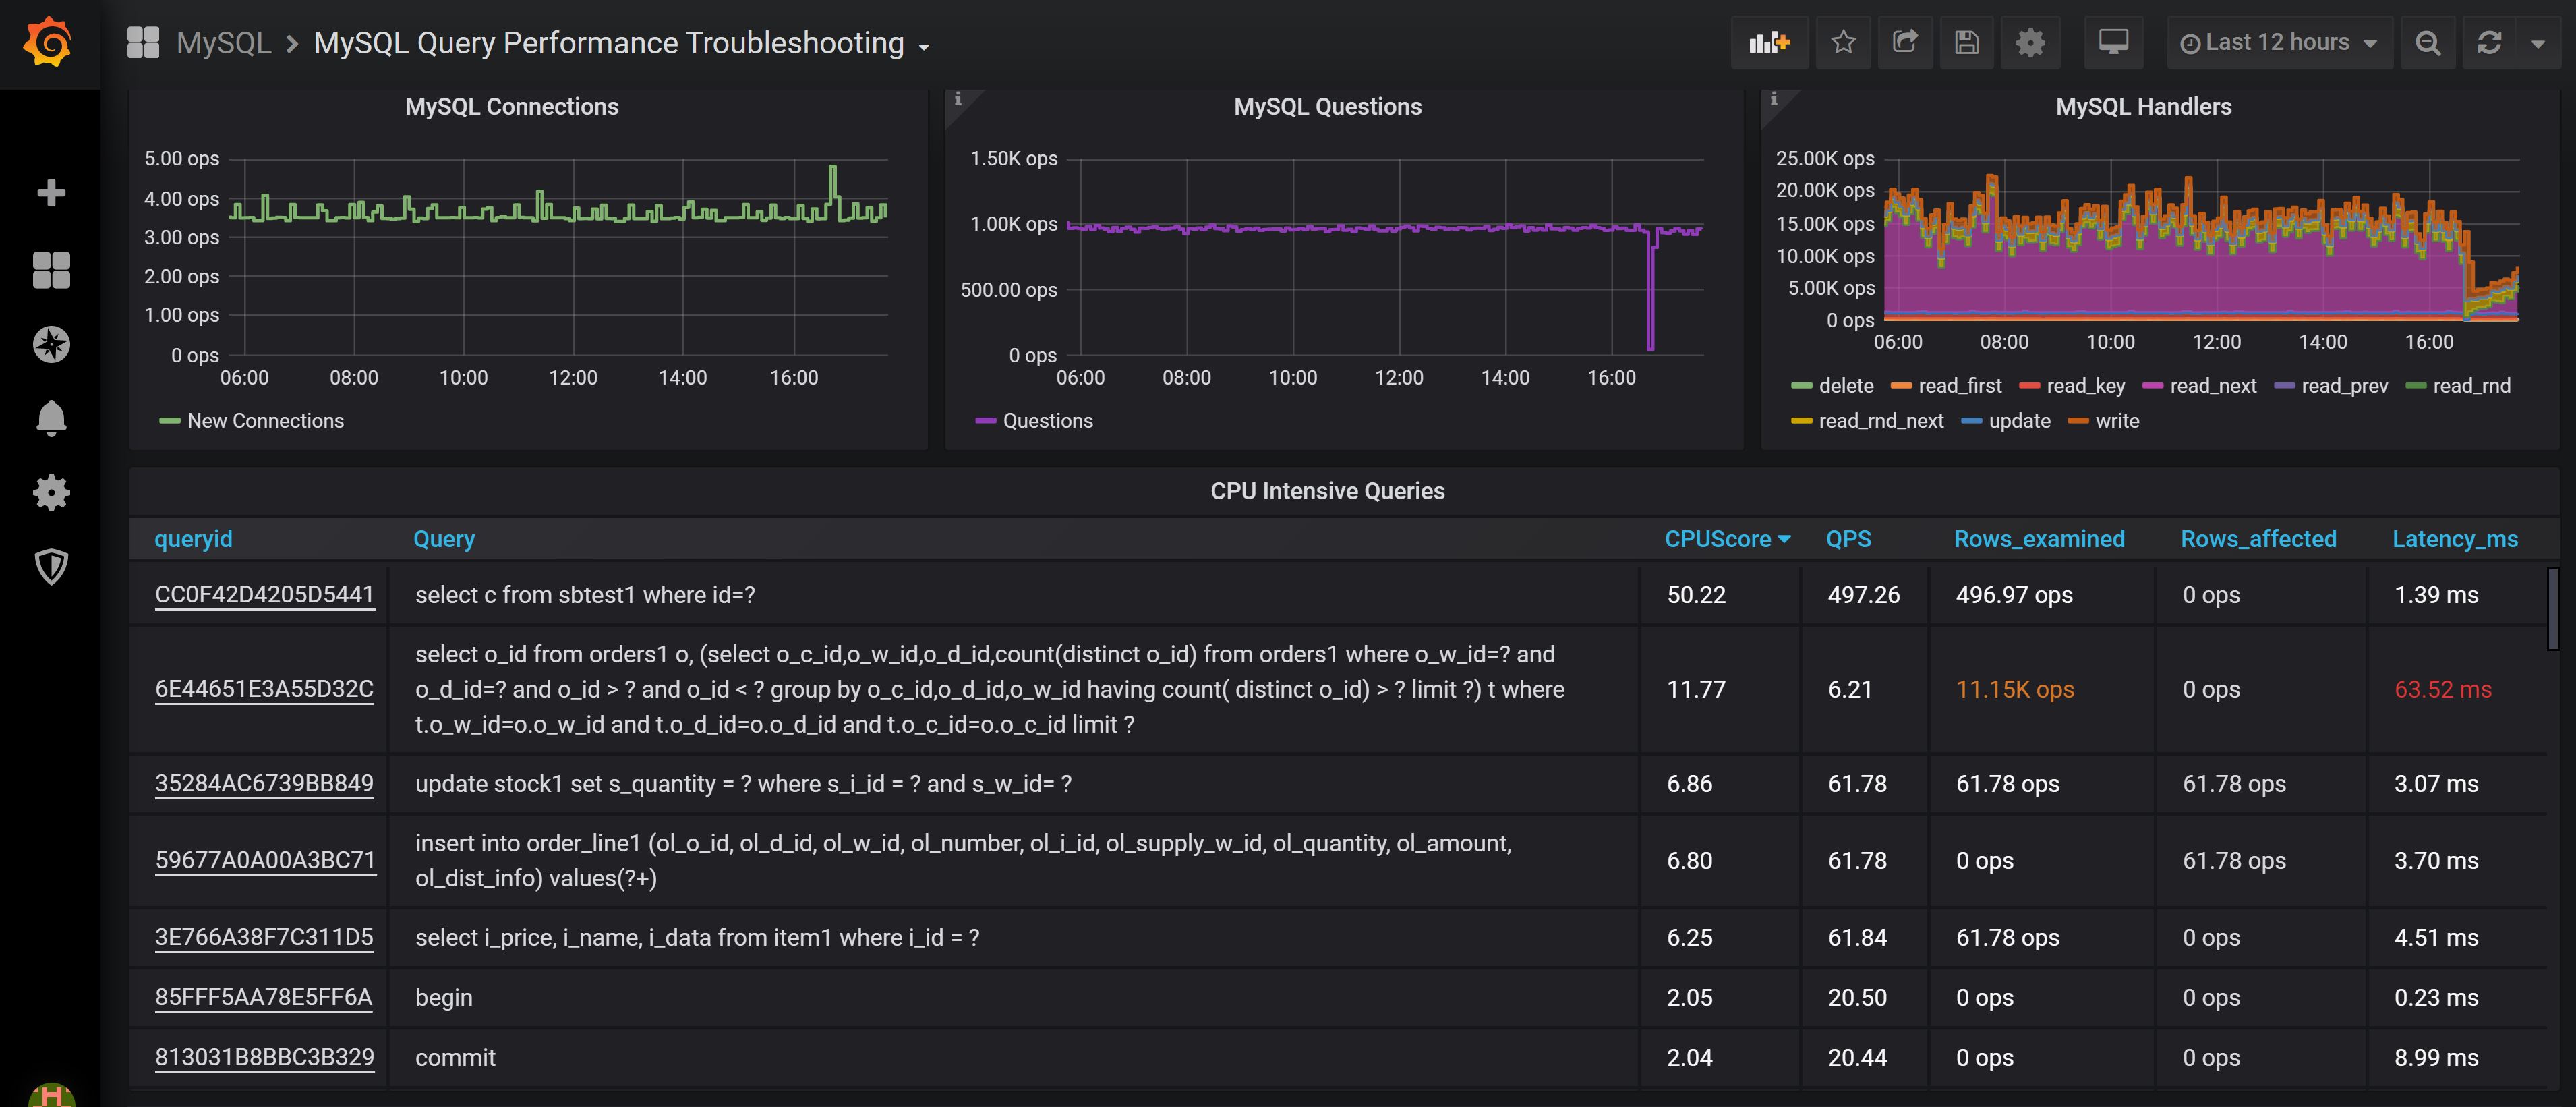
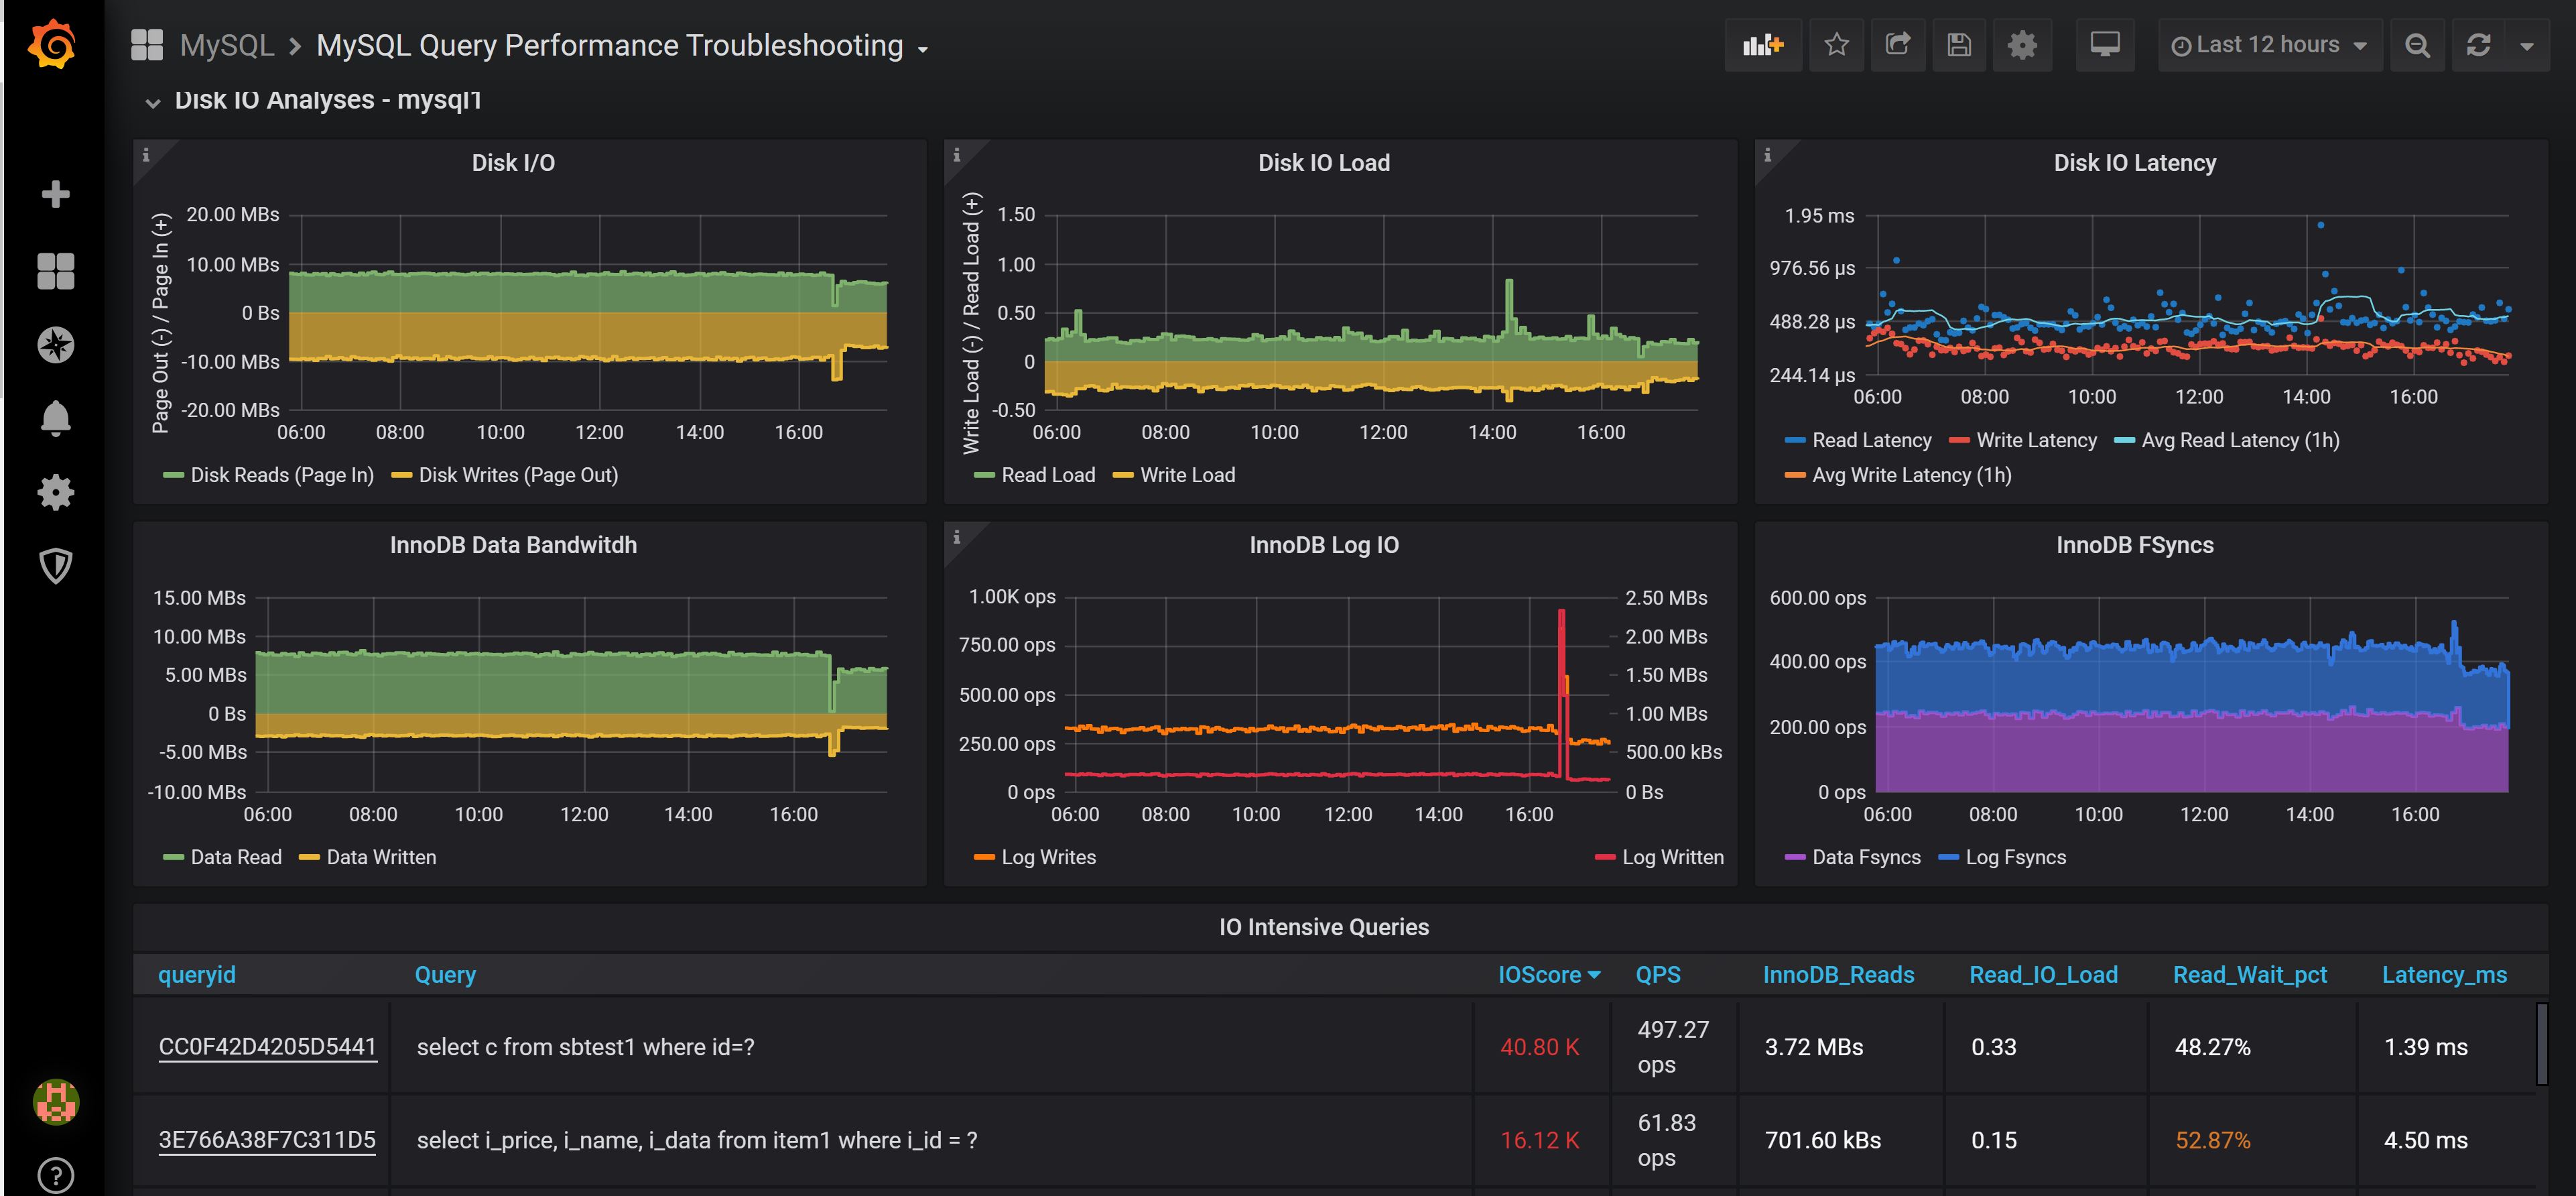
This dashboards allows you to troubleshoot queries which are heavy on system resources CPU, Disk, Network, Memory or which cause extensive Locking on the database level
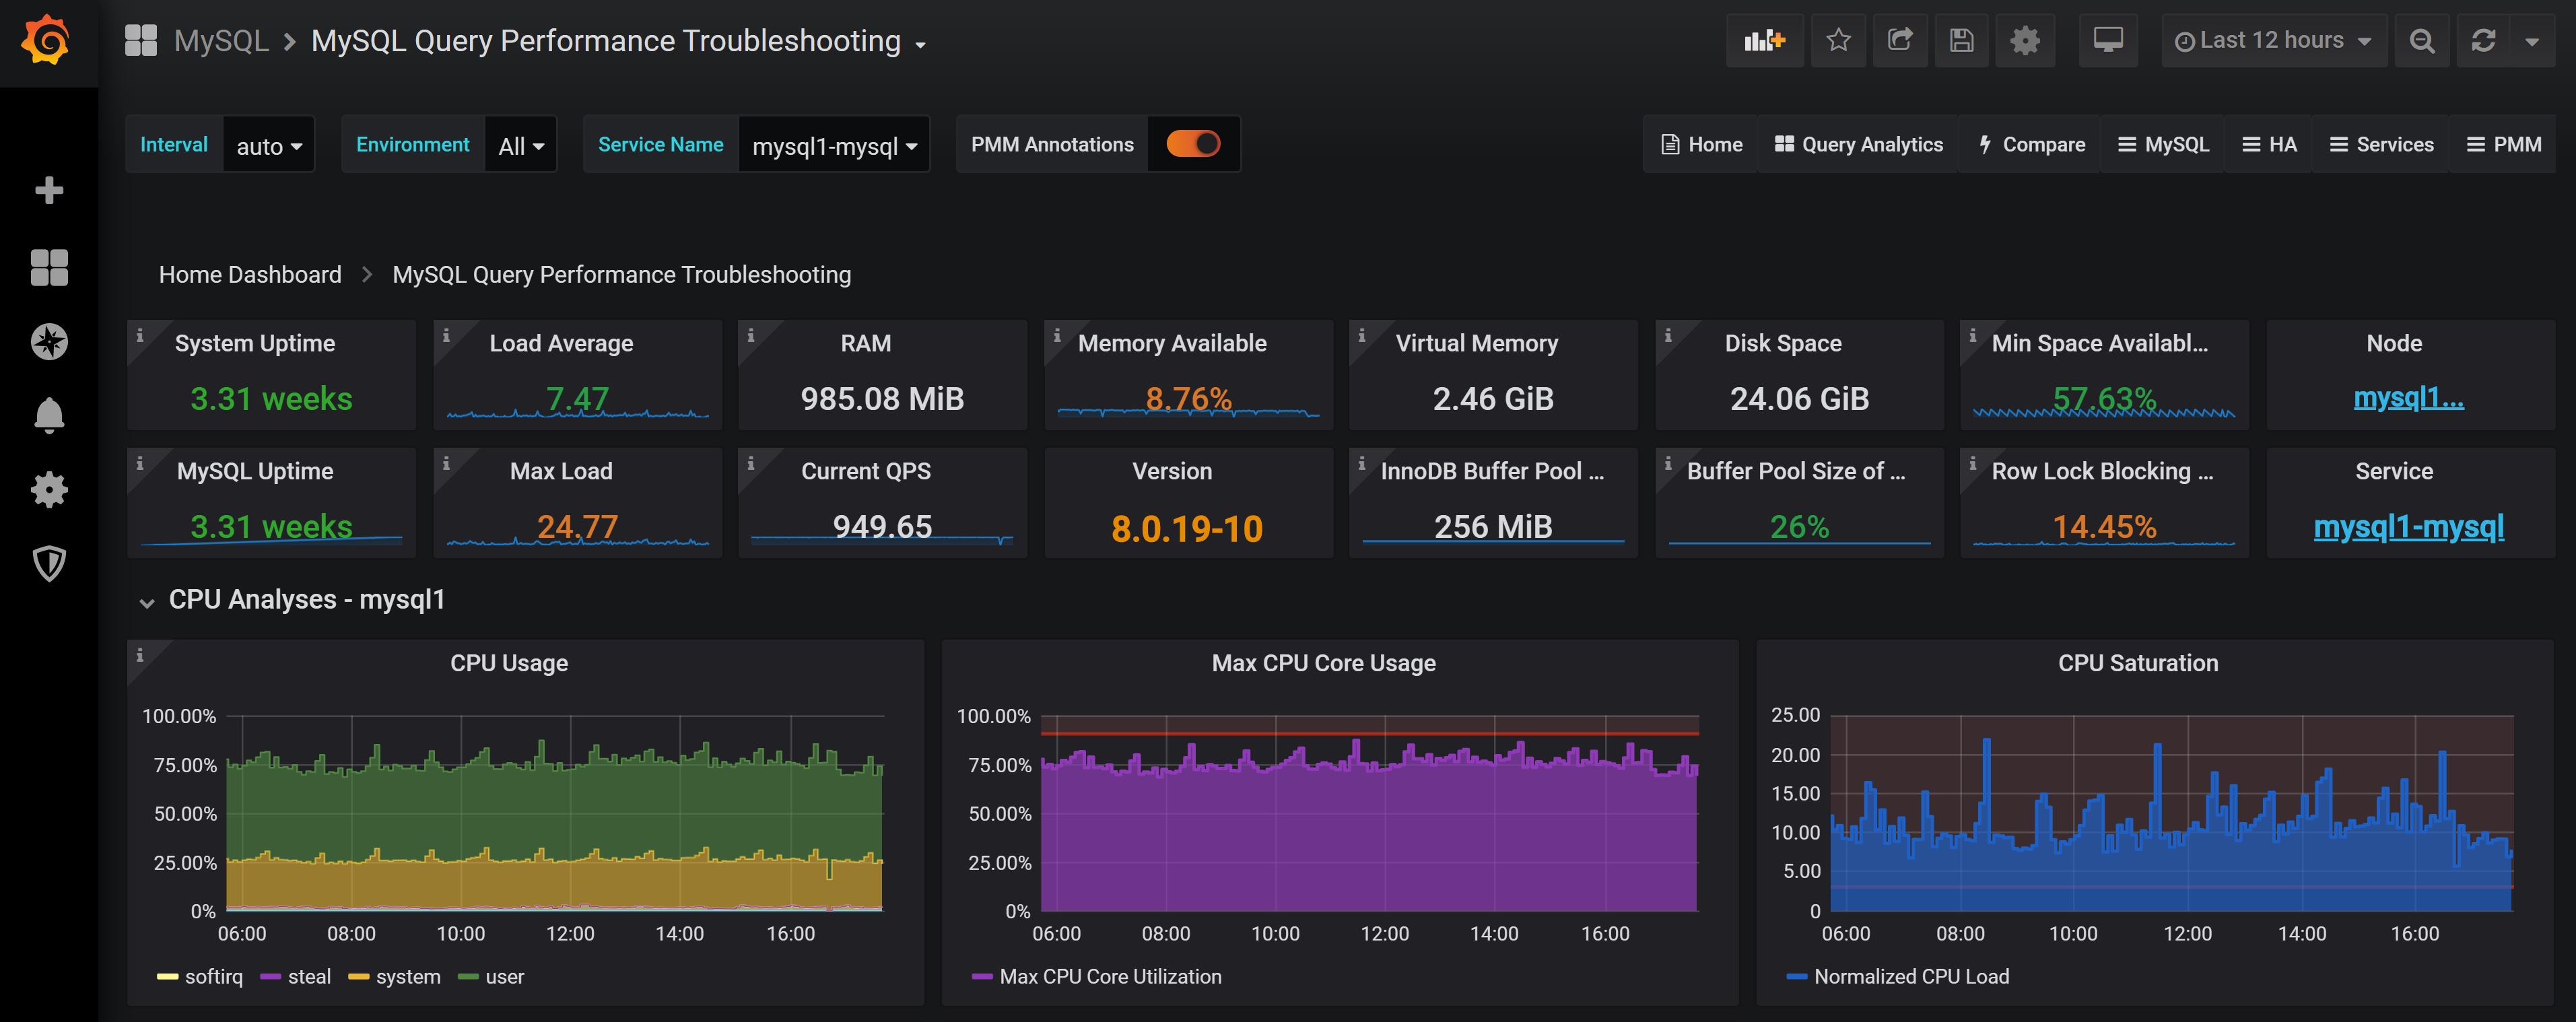
The MySQL Query Performance Troubleshooting (Designed for PMM2) dashboard uses the prometheus and vertamedia-clickhouse-datasource data sources to create a Grafana dashboard with the digiapulssi-breadcrumb-panel, graph, singlestat, table and text panels.
Data source config
Collector type:
Collector plugins:
Collector config:
Revisions
Upload an updated version of an exported dashboard.json file from Grafana
| Revision | Description | Created | |
|---|---|---|---|
| Download |
MySQL
Monitor MySQL with Grafana. Easily monitor your MySQL deployment with Grafana Cloud's out-of-the-box monitoring solution.
Learn more