OS stats - Linux
Presentation of OS metrics collected from Metricbeat. Also including logs for correlation with logs from filebeat.
Display metrics collected with metricbeat, also... possibility to correlate your metrics with logs collected with filebeat
About Dashboard:
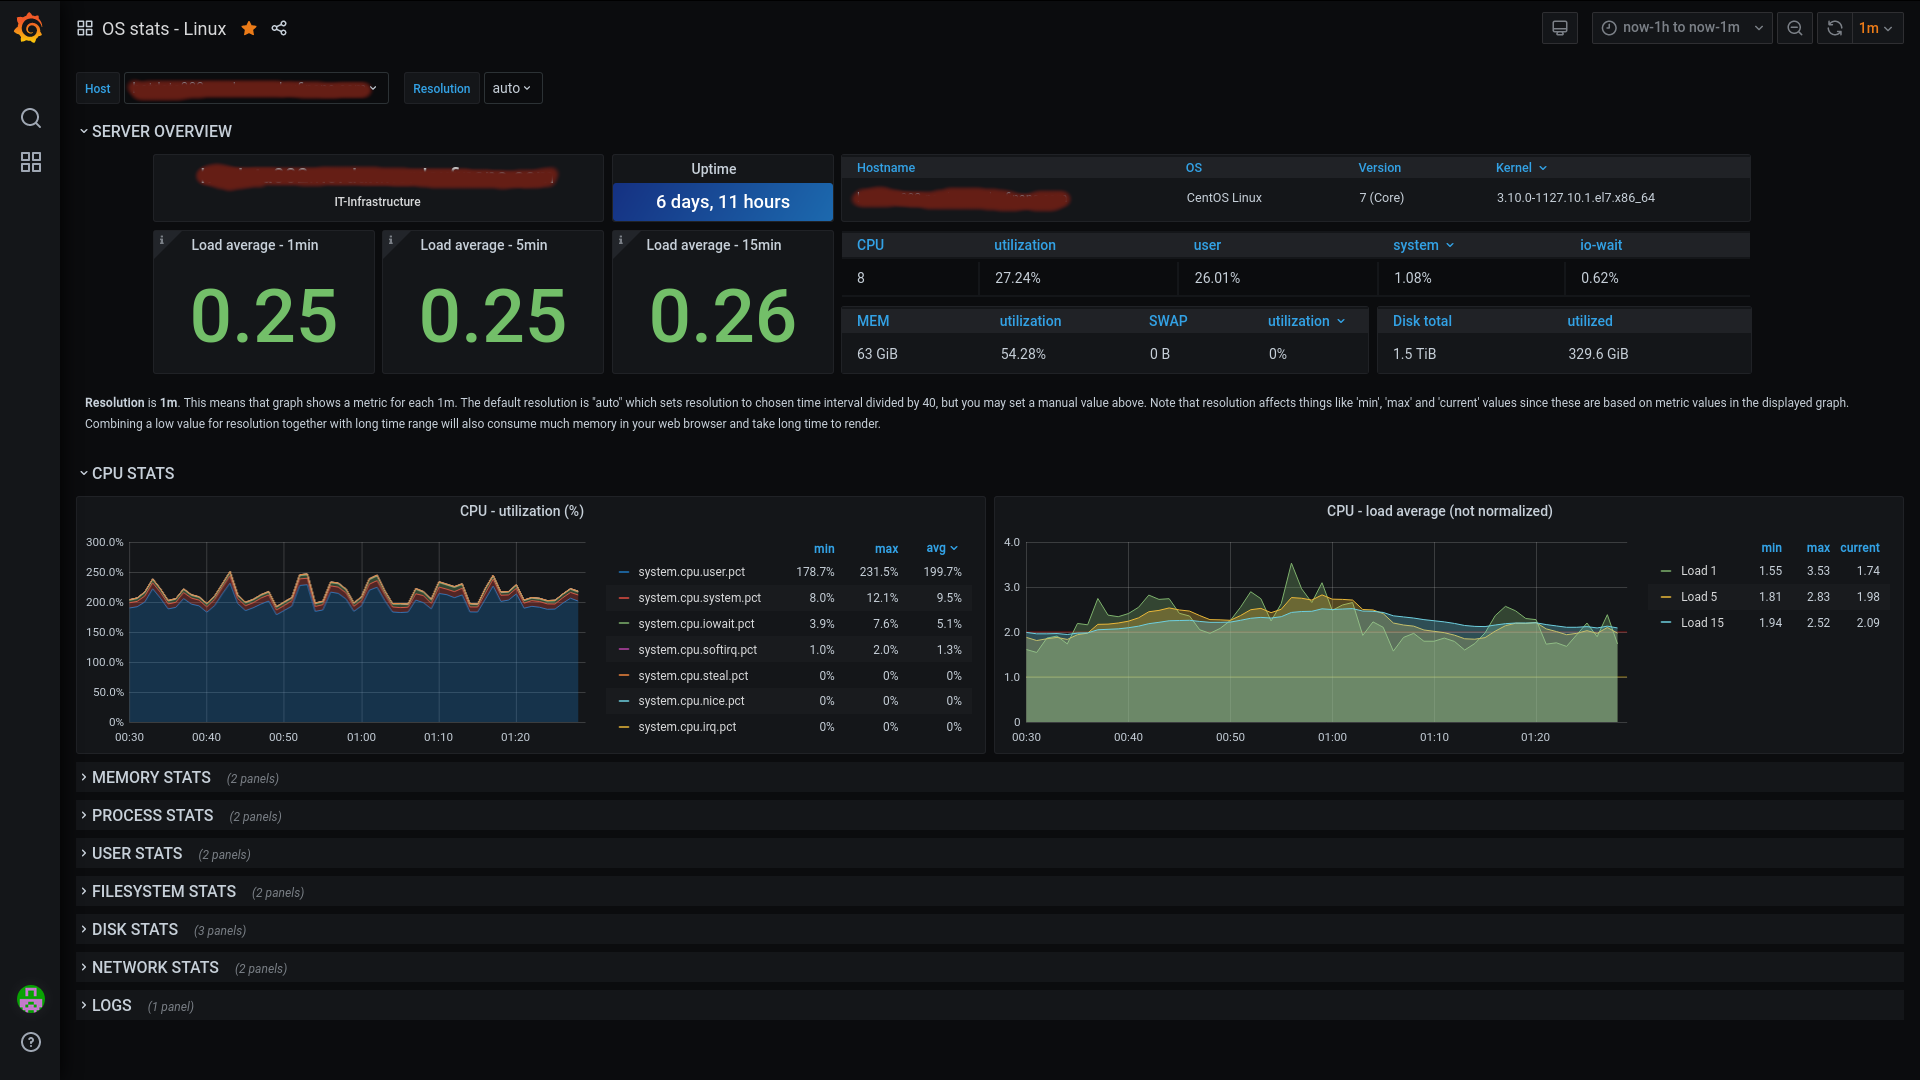
- Server overview
- Cpu stats
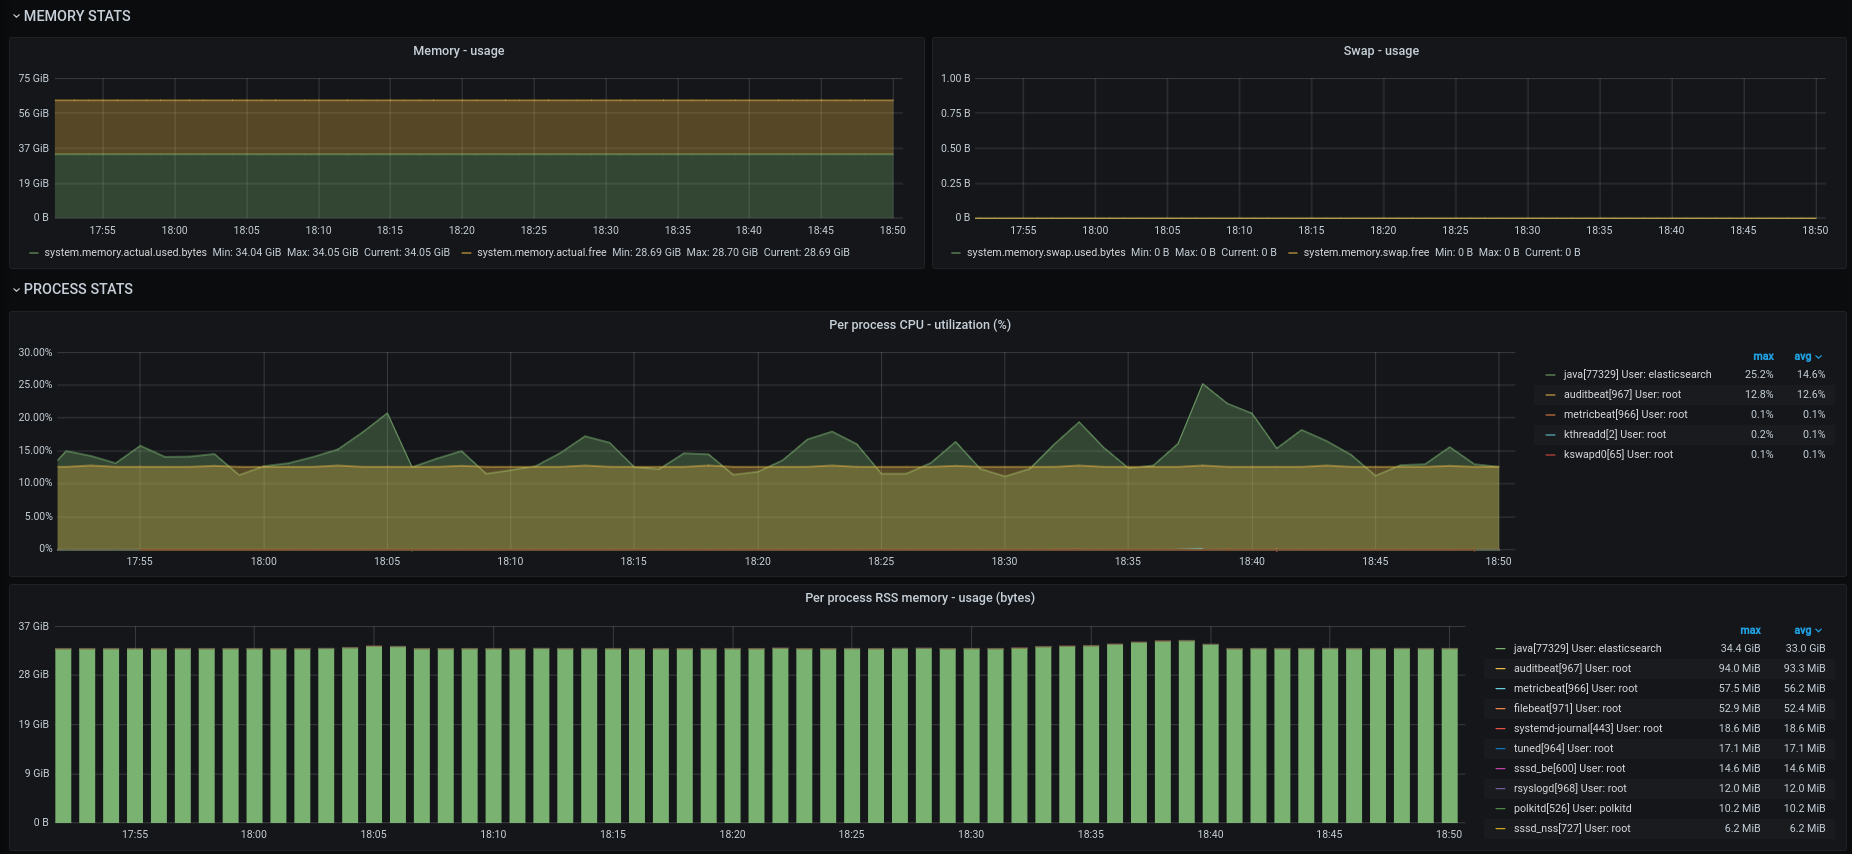
- Memory stats, actual used and swap
- Process stats, per process cpu utilization, per process RSS memory utilization
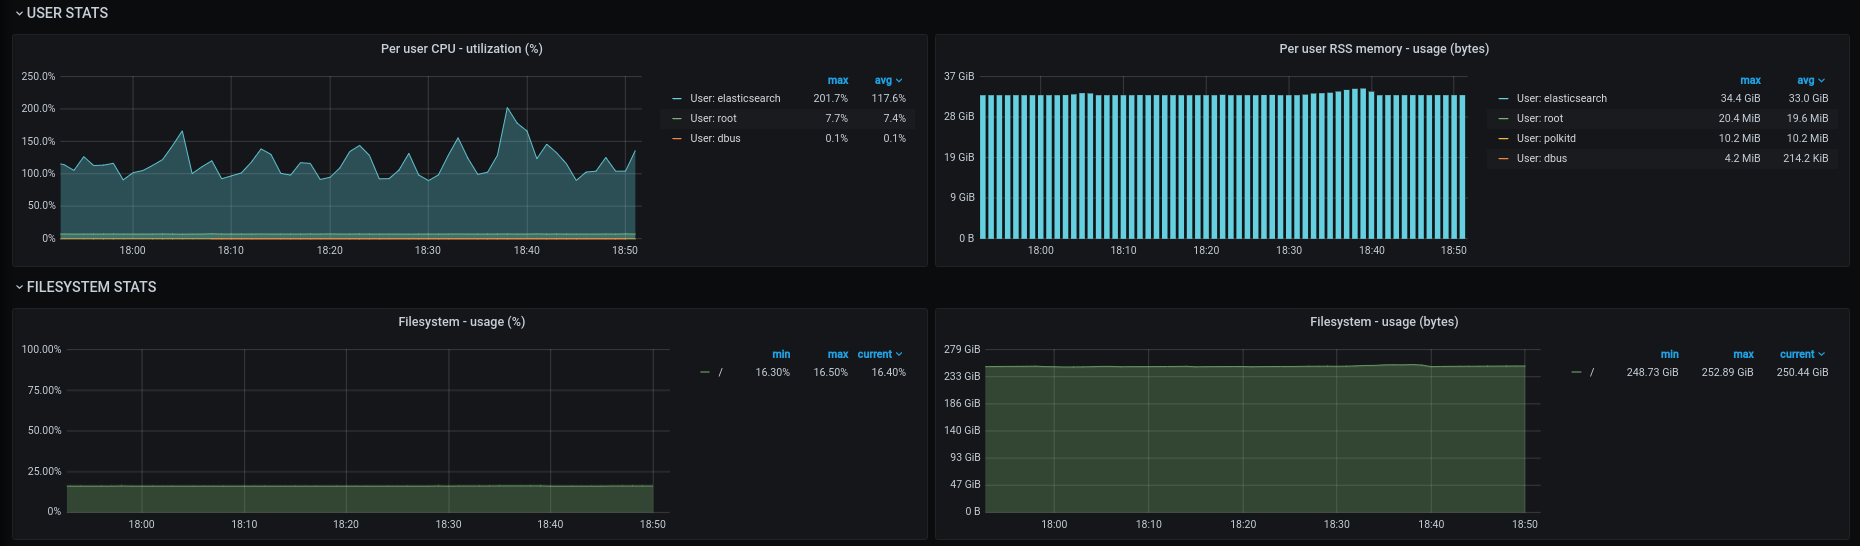
- User stats, utilization cpu and RSS memory usage per user
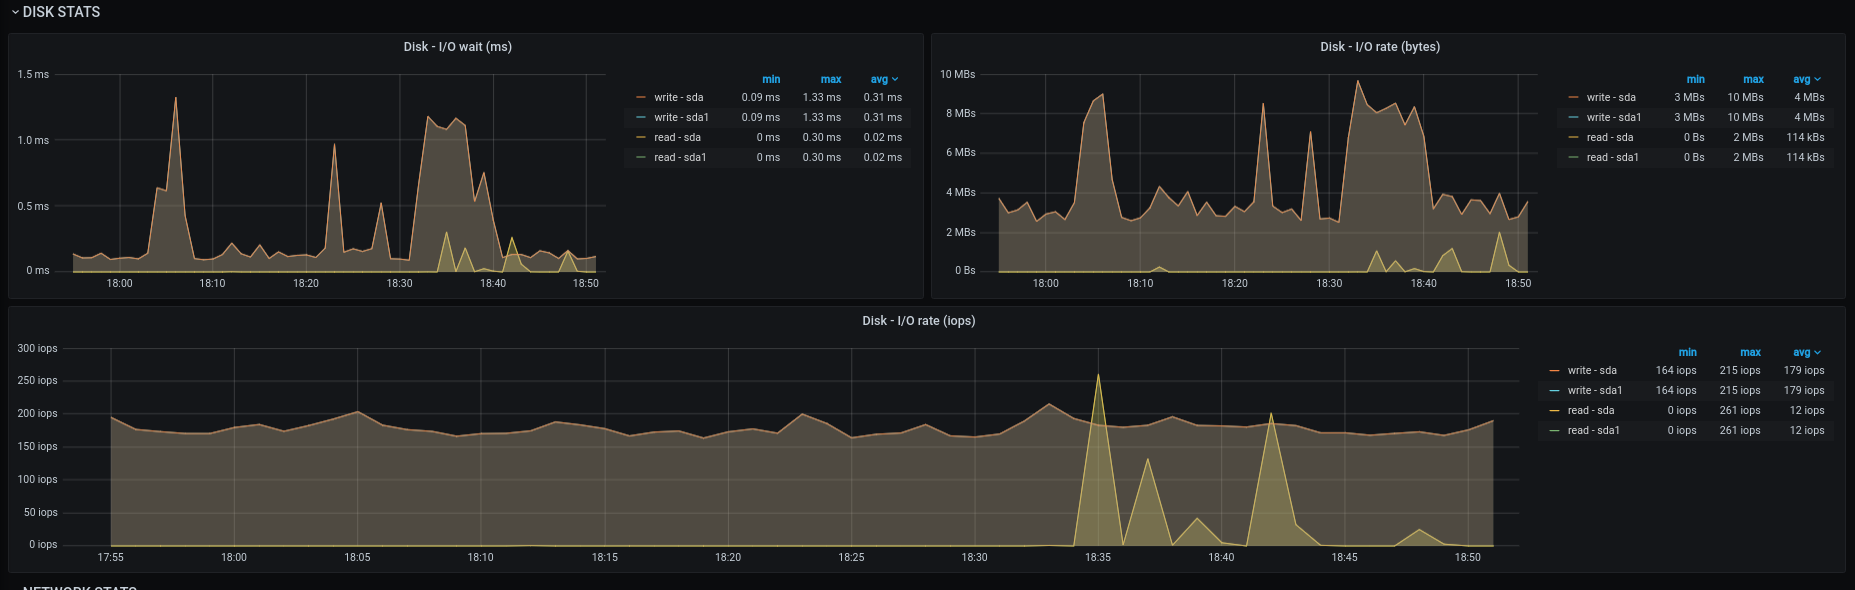
- Disk stats, io-wait, io-rate, iops
- Filesystam stats, usage in percent and bytes per disk
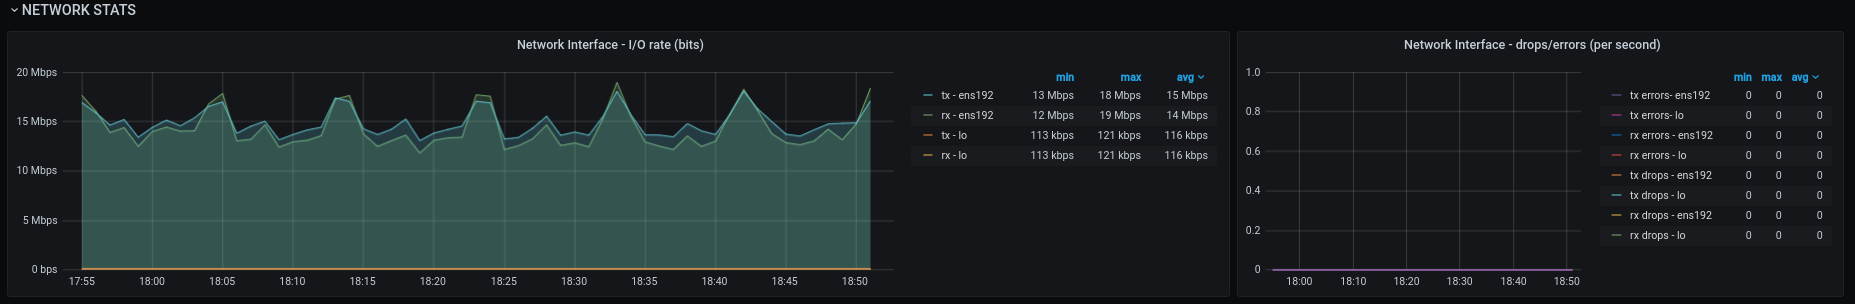
- Network stats, io rate, drops/errors
- Logs collected with filebeat
Data source config
Collector type:
Collector plugins:
Collector config:
Revisions
Upload an updated version of an exported dashboard.json file from Grafana
| Revision | Description | Created | |
|---|---|---|---|
| Download |
Linux Server
Monitor Linux with Grafana. Easily monitor your Linux deployment with Grafana Cloud's out-of-the-box monitoring solution.
Learn more