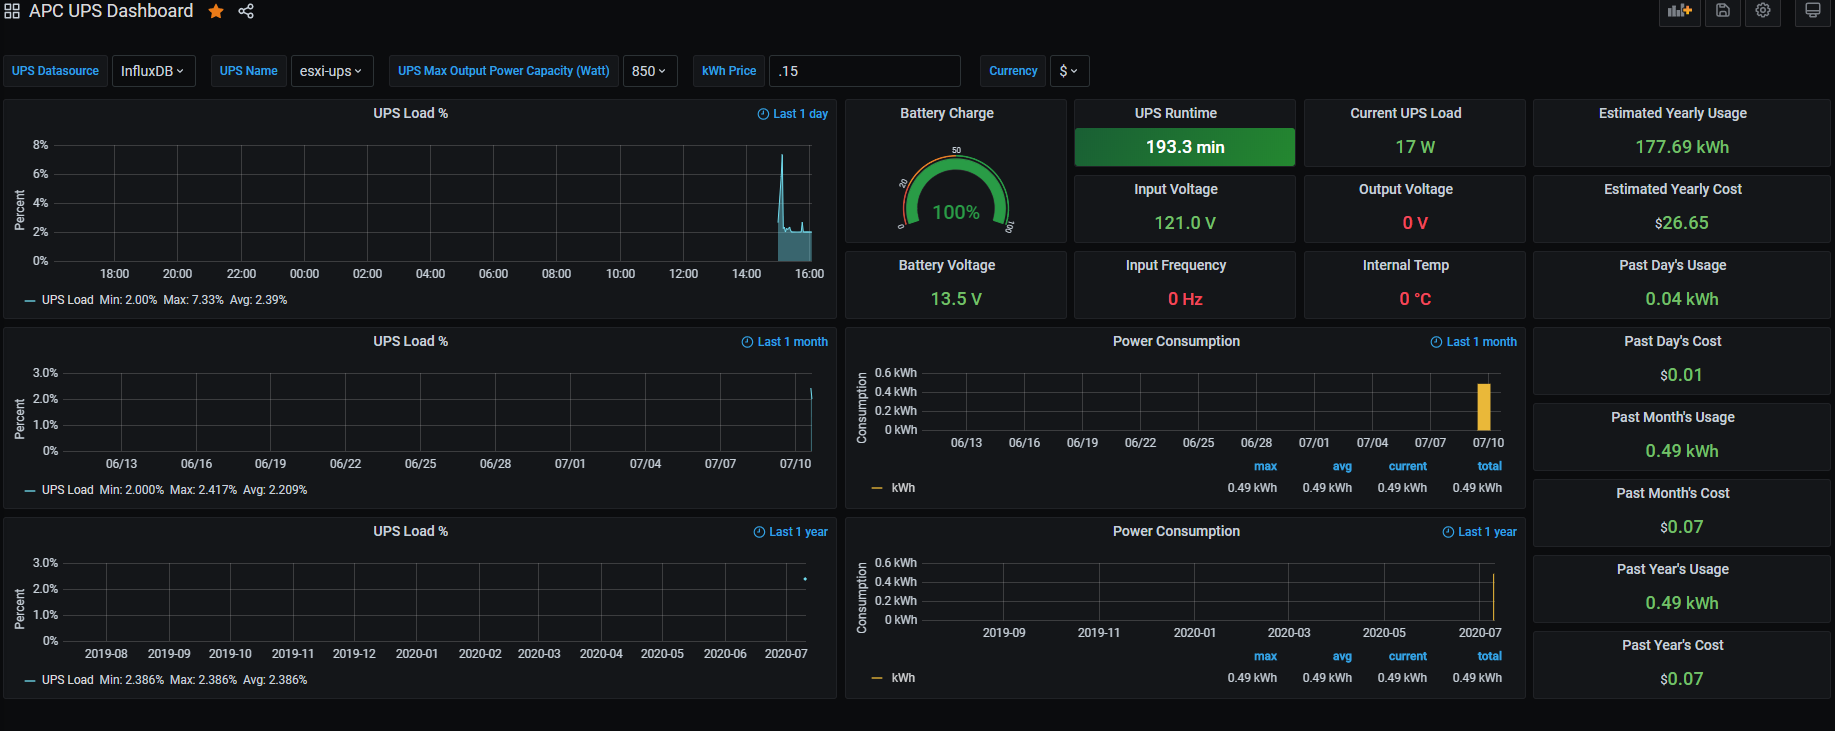
APC UPS Dashboard
Inspiration taken from https://grafana.com/grafana/dashboards/10835 - Thank you, anthonysomerset. I've corrected some math errors, and updated it to work with multiple UPSs in the same database.
This dashboard show information about your UPS from apcupsd --> Telegraf --> InfluxDB. It calculates power use from the UPS model number (maximum wattage load) and load percent, since wattage isn't a data point we can collect.
Data source config
Collector type:
Collector plugins:
Collector config:
Revisions
Upload an updated version of an exported dashboard.json file from Grafana
| Revision | Description | Created | |
|---|---|---|---|
| Download |
