Cluster Autoscaler Stats
Super simple dashboard showing an overview of Kubernetes cluster autoscaling activity and status, using metrics reported by the autoscaler to Prometheus. Prometheus datasource can be chosen.
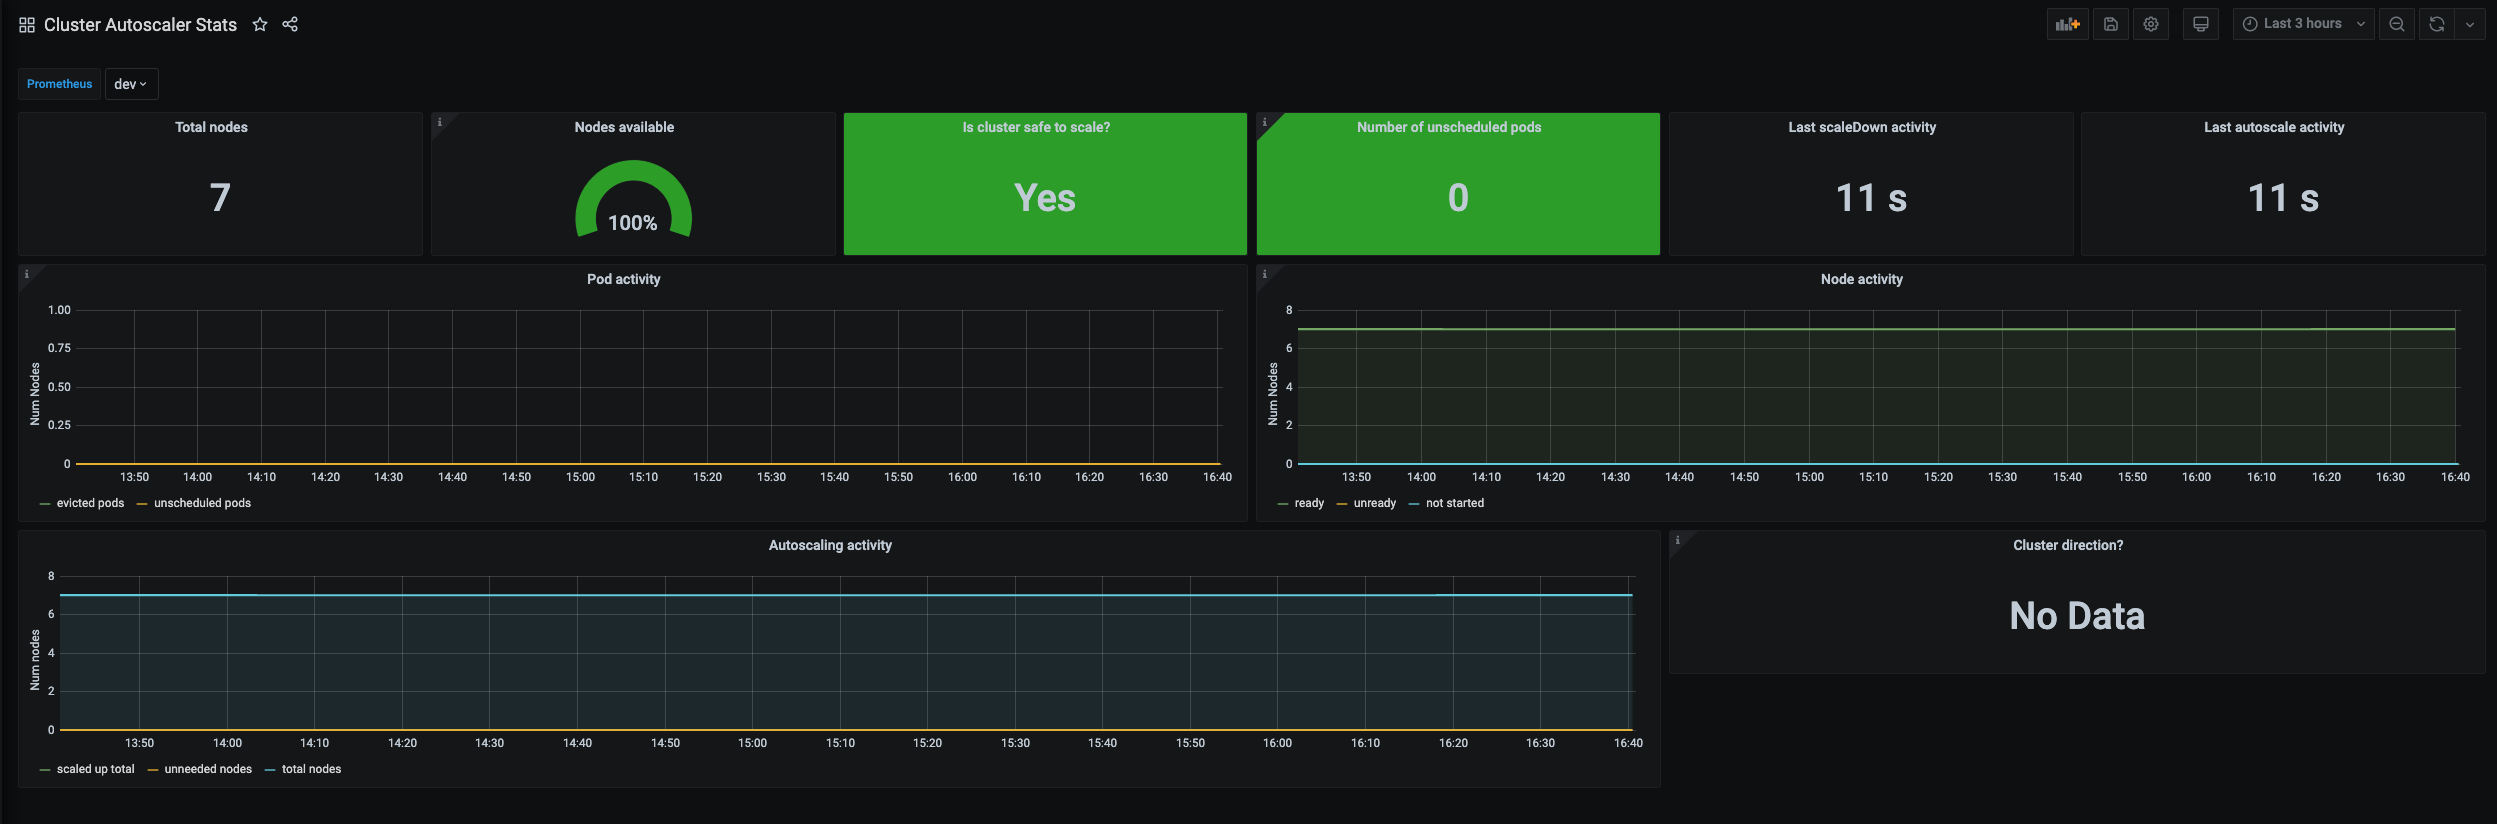
The Cluster Autoscaler Stats dashboard uses the prometheus data source to create a Grafana dashboard with the graph and singlestat panels.
Data source config
Collector type:
Collector plugins:
Collector config:
Revisions
Upload an updated version of an exported dashboard.json file from Grafana
| Revision | Description | Created | |
|---|---|---|---|
| Download |
Kubernetes
Monitor your Kubernetes deployment with prebuilt visualizations that allow you to drill down from a high-level cluster overview to pod-specific details in minutes.
Learn more