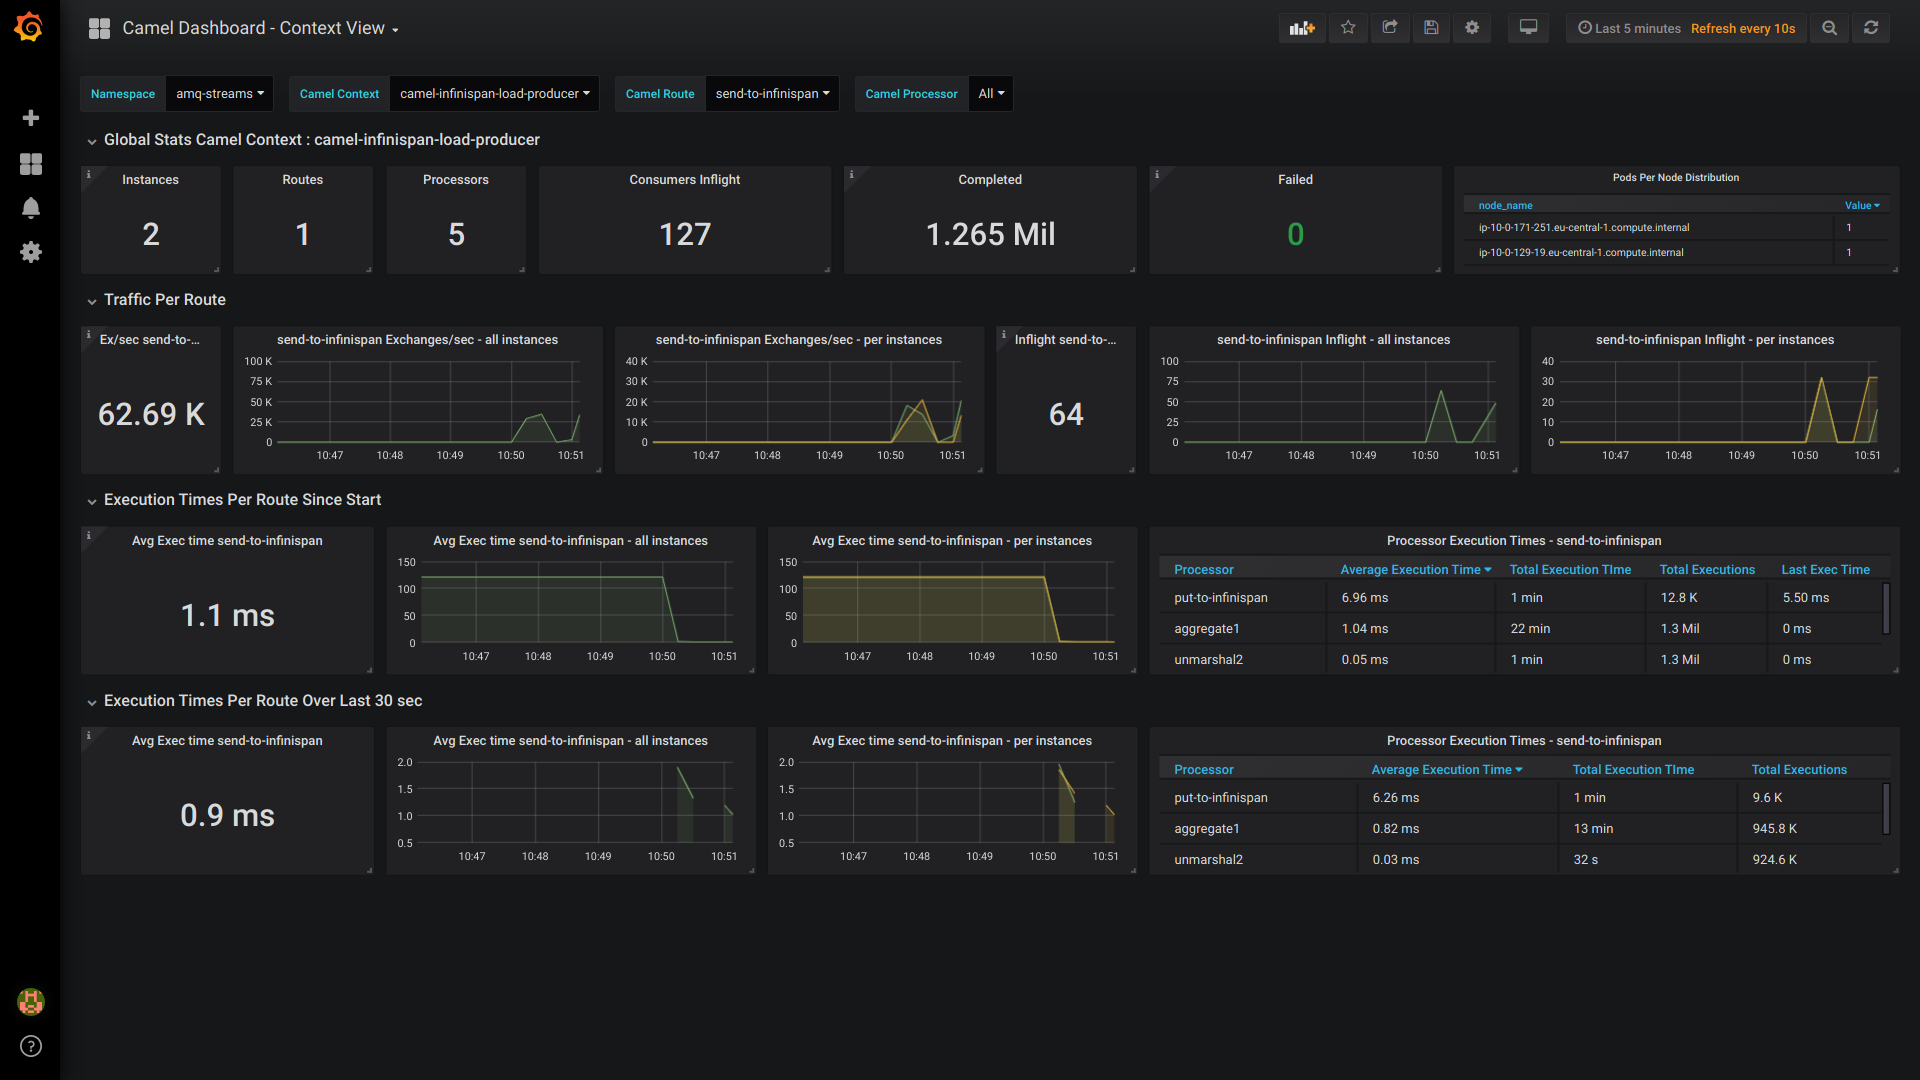
Apache Camel - Prometheus JMX Exporter
Performance oriented monitoring on Apache Camel deployments. Works ideally on Kubernetes deployments. Based on Prometheus datasource scraping JMX exporter metrics configured on Apache Camel JMX MBeans. Focuses on analyzing Camel Context, Route & Processor execution times and throughput. * update 2023-05-06 : it's now prefered to use the dashboard based on micrometer metrics. It's the most up to date and the one that will be maintained in the future.
THIS DASHBOARD USES THE OLDER JMX EXPORTER INSTRUMENTATION AVAILABLE FOR CAMEL 2. FOR BETTER SUPPORT SEE THIS NEWER VERSION OF THE DASHBOARD ID 16764.
Watch a demo video here : https://www.youtube.com/watch?v=0LDgv1nIk-Y
or here https://odysee.com/@alainpham:8/apache-camel-monitoring-prometheus-grafana:c
Here is the git repo for setting up the demo : https://github.com/alainpham/app-archetypes
Feel free to asks questions and send me feedback on LinkedIn or Twitter
Data source config
Collector config:
Upload an updated version of an exported dashboard.json file from Grafana
| Revision | Description | Created | |
|---|---|---|---|
| Download |
Metrics Endpoint (Prometheus)
Easily monitor any Prometheus-compatible and publicly accessible metrics URL with Grafana Cloud's out-of-the-box monitoring solution.
Learn more
