
Microsoft Dynamics NAV Performance Metrics
View more than 30x performance counters for Microsoft Dynamics NAV in Grafana. This dashboard uses Telegraf client to pull performance metrics via the inputs.win_perf_counters.object to InfluxDB and Grafana.
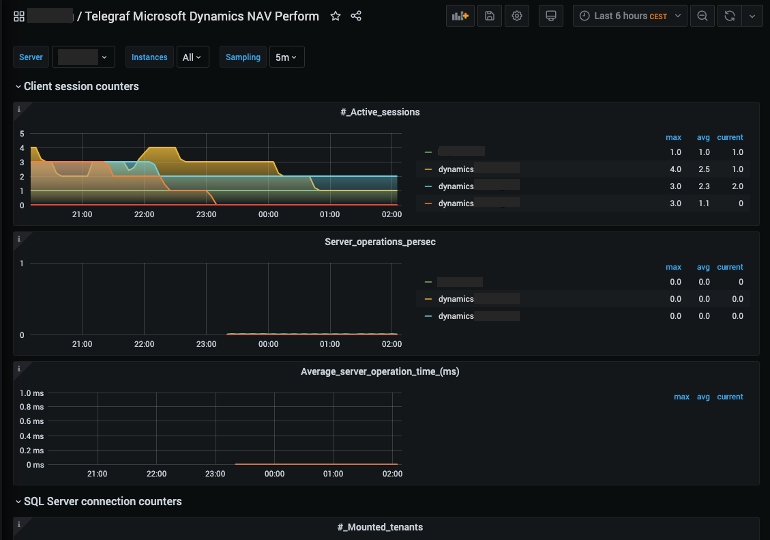
This dashboard collects all 31x “performance counters” that is available for Microsoft Dynamics NAV via performance collector objects in Microsoft Windows. These are the metrics you can see in the “perfmon” tool in Windows. Now you can see it in style in Grafana and better yet over a longer period of time.
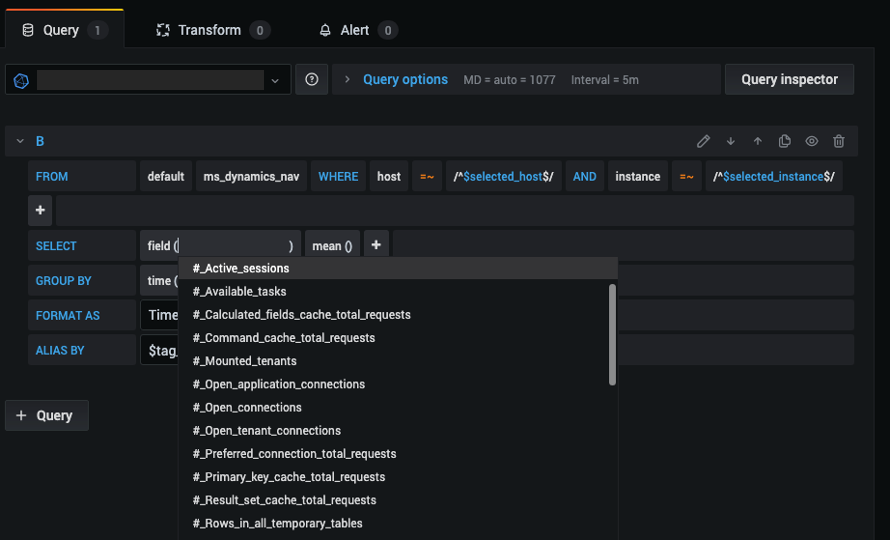
The Grafana template uses the Telegraf client to pull performance metrics via the inputs.win_perf_counters.object. Example Telegraf input plugin configuration is attached in this template post.
Features:
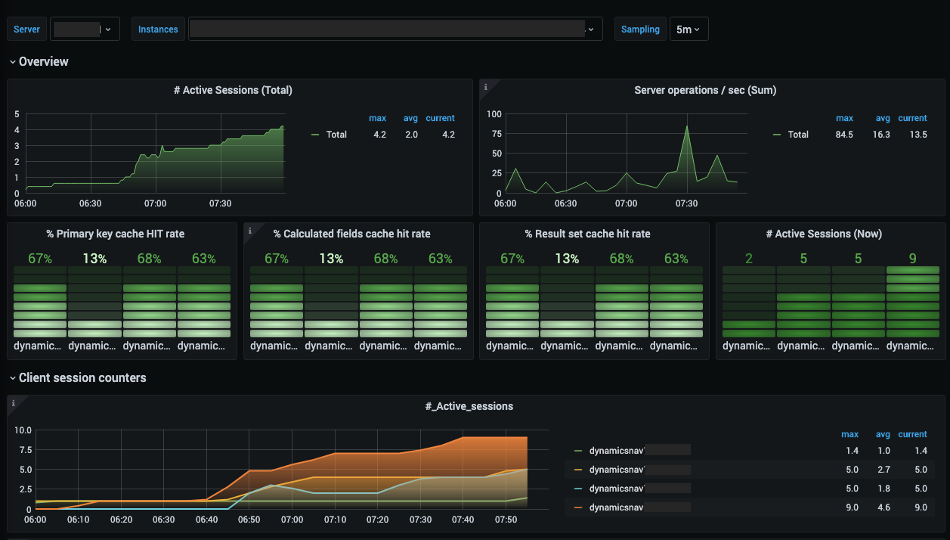
- Variables setup for “selected_host”, “selected_instance” allow you to select what host and which Dynamics instance to monitor.
- Variable for “Sampling Interval” allows you to smooth the curve to the best sampling rate.
Steps to get going:
- Create an InfluxDB named “dynamics_monitoring_results”
- Install Telegraf Windows client on your server. (see many other blog posts about this)
- Set your agent to measure every 1min.
- Configure your Telegraf client to capture the Dynamics performance counters (details in Collector Config section)
- Make sure you set your input agent to save to a metric called “ms_dynamics_nav” this will be the metric name in InfluxDB and Grafana: ( Measurement = “ms_dynamics_nav” )
- Test your Telegraf config with console mode, debug and command line output (in influxdb format) before starting it as a service. For example: “c:\Program Files\telegraf\telegraf.exe” –console –debug –config “c:\Program Files\telegraf\telegraf.conf”
- Run your Telegraf client as a service. (see many other blog posts about this)
- When you import this template, select the datasource that you created in step 1.
Start watching your Dynamics instances.
Note: This dashboard was tested with Microsoft Dynamics NAV 2017.
Data source config
Collector config:
Dashboard revisions
Upload an updated version of an exported dashboard.json file from Grafana
| Revision | Decscription | Created | |
|---|---|---|---|
| Download |
Get this dashboard
Data source:
Dependencies: