Ansible AWX
Ansible AWX dashboard valid for ansible tower also
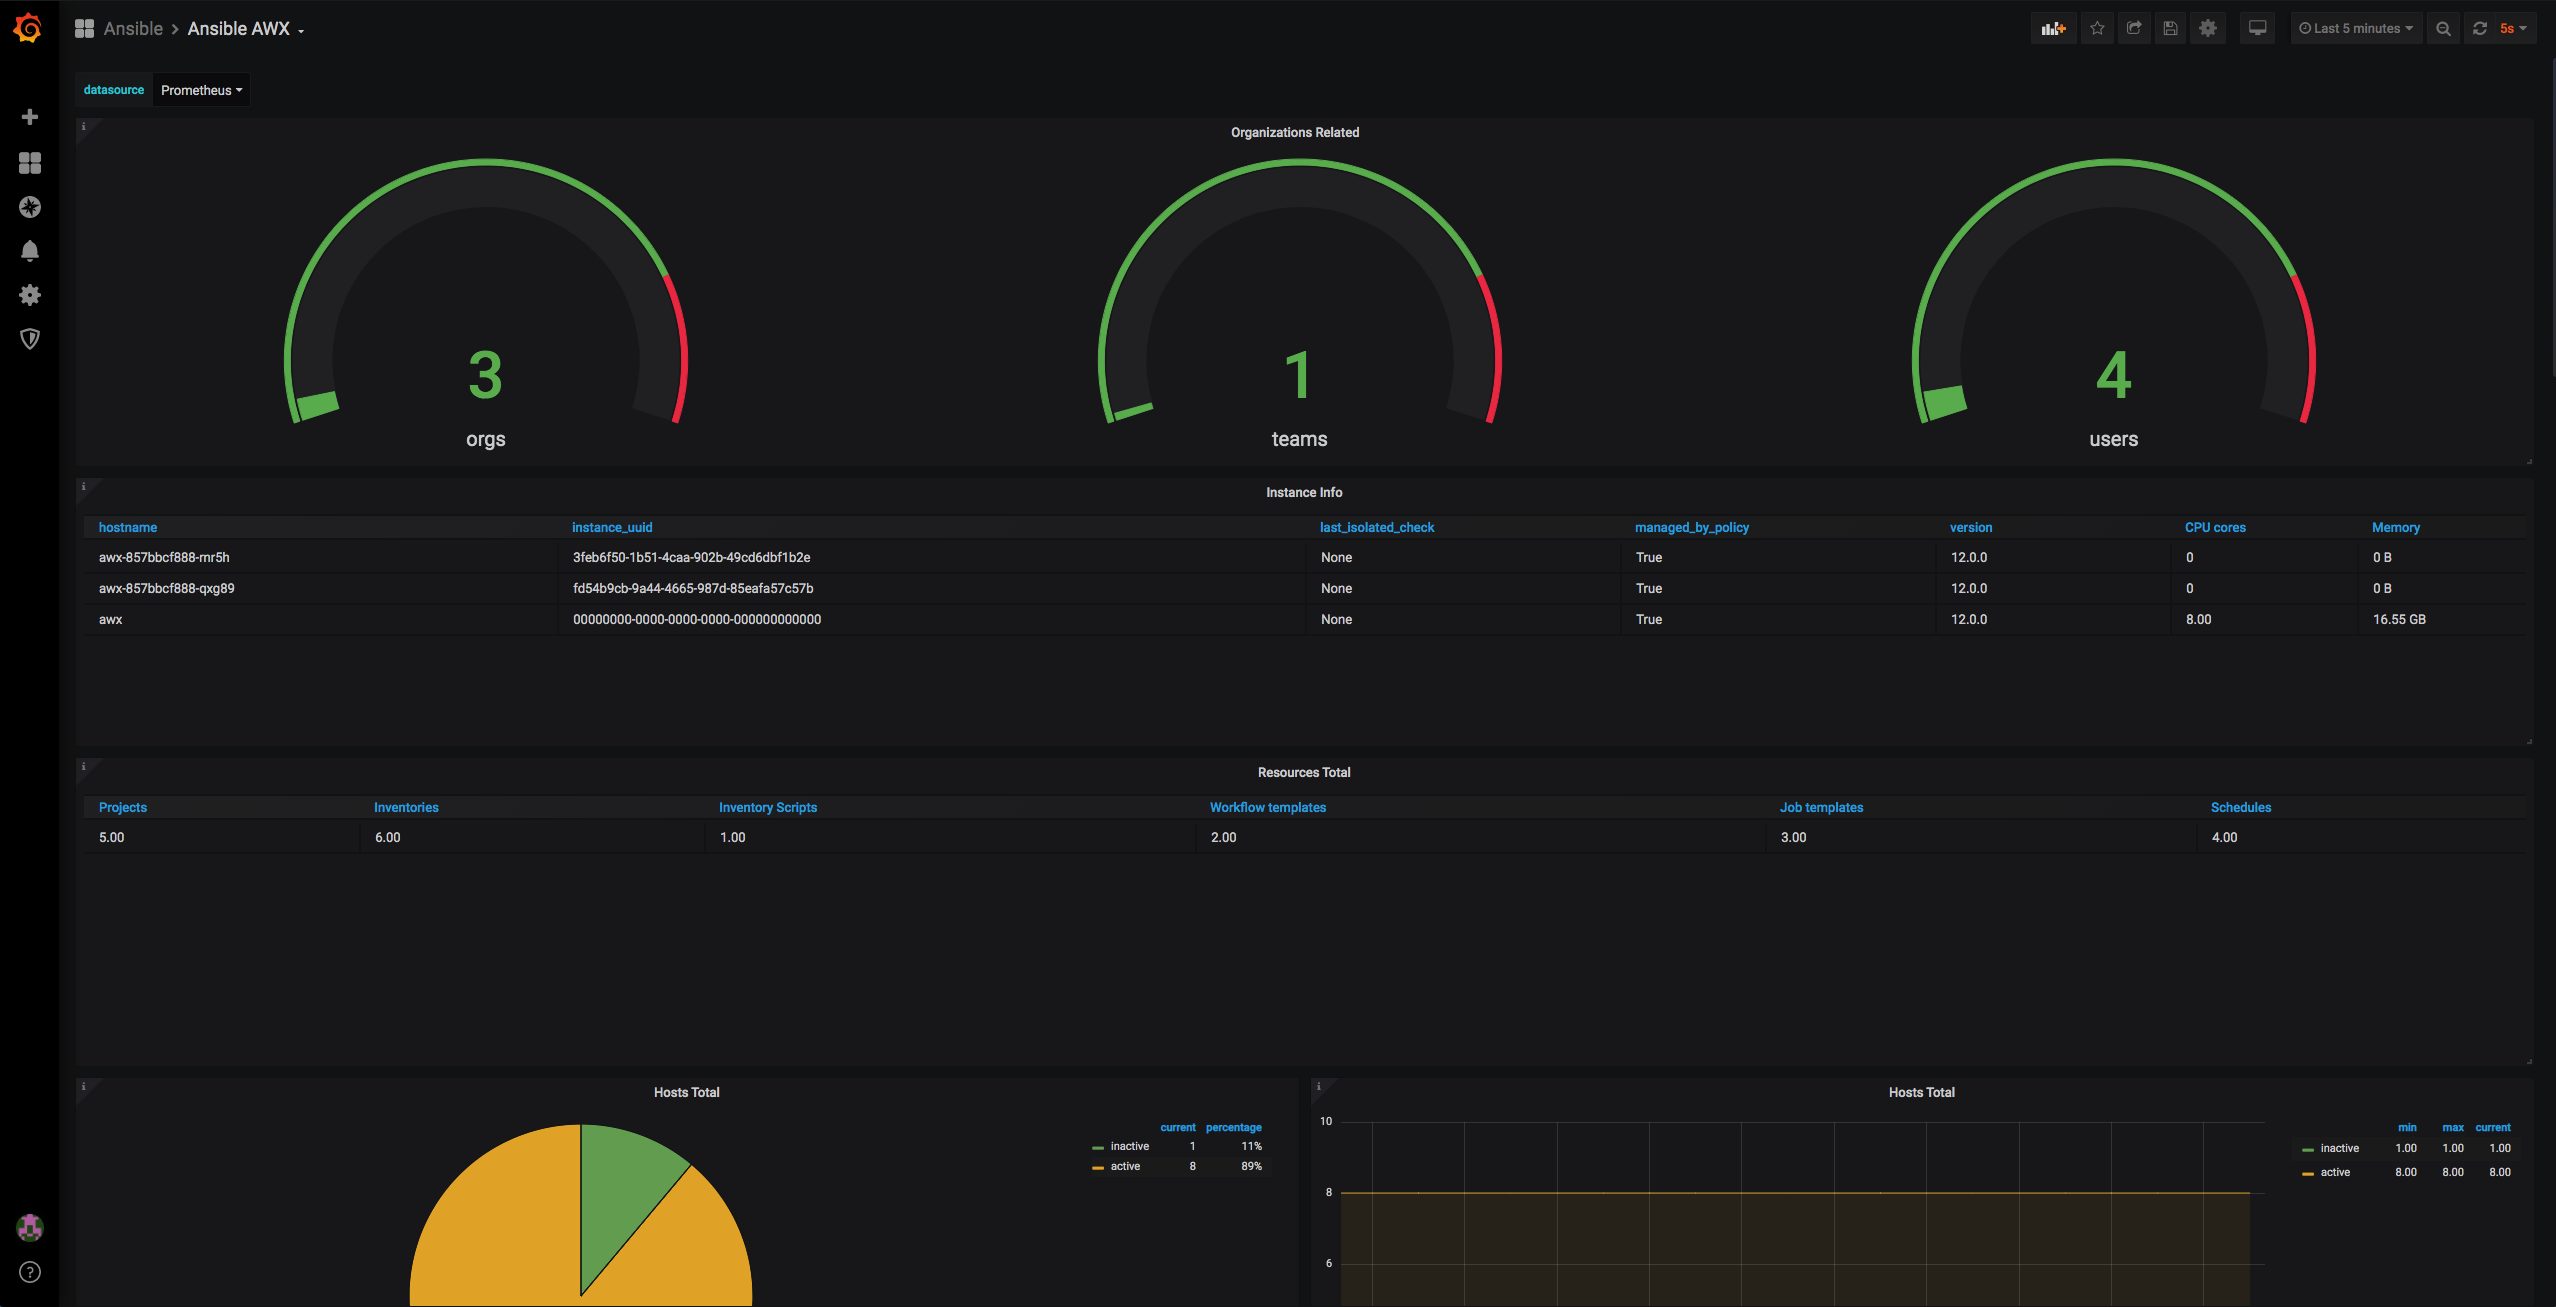
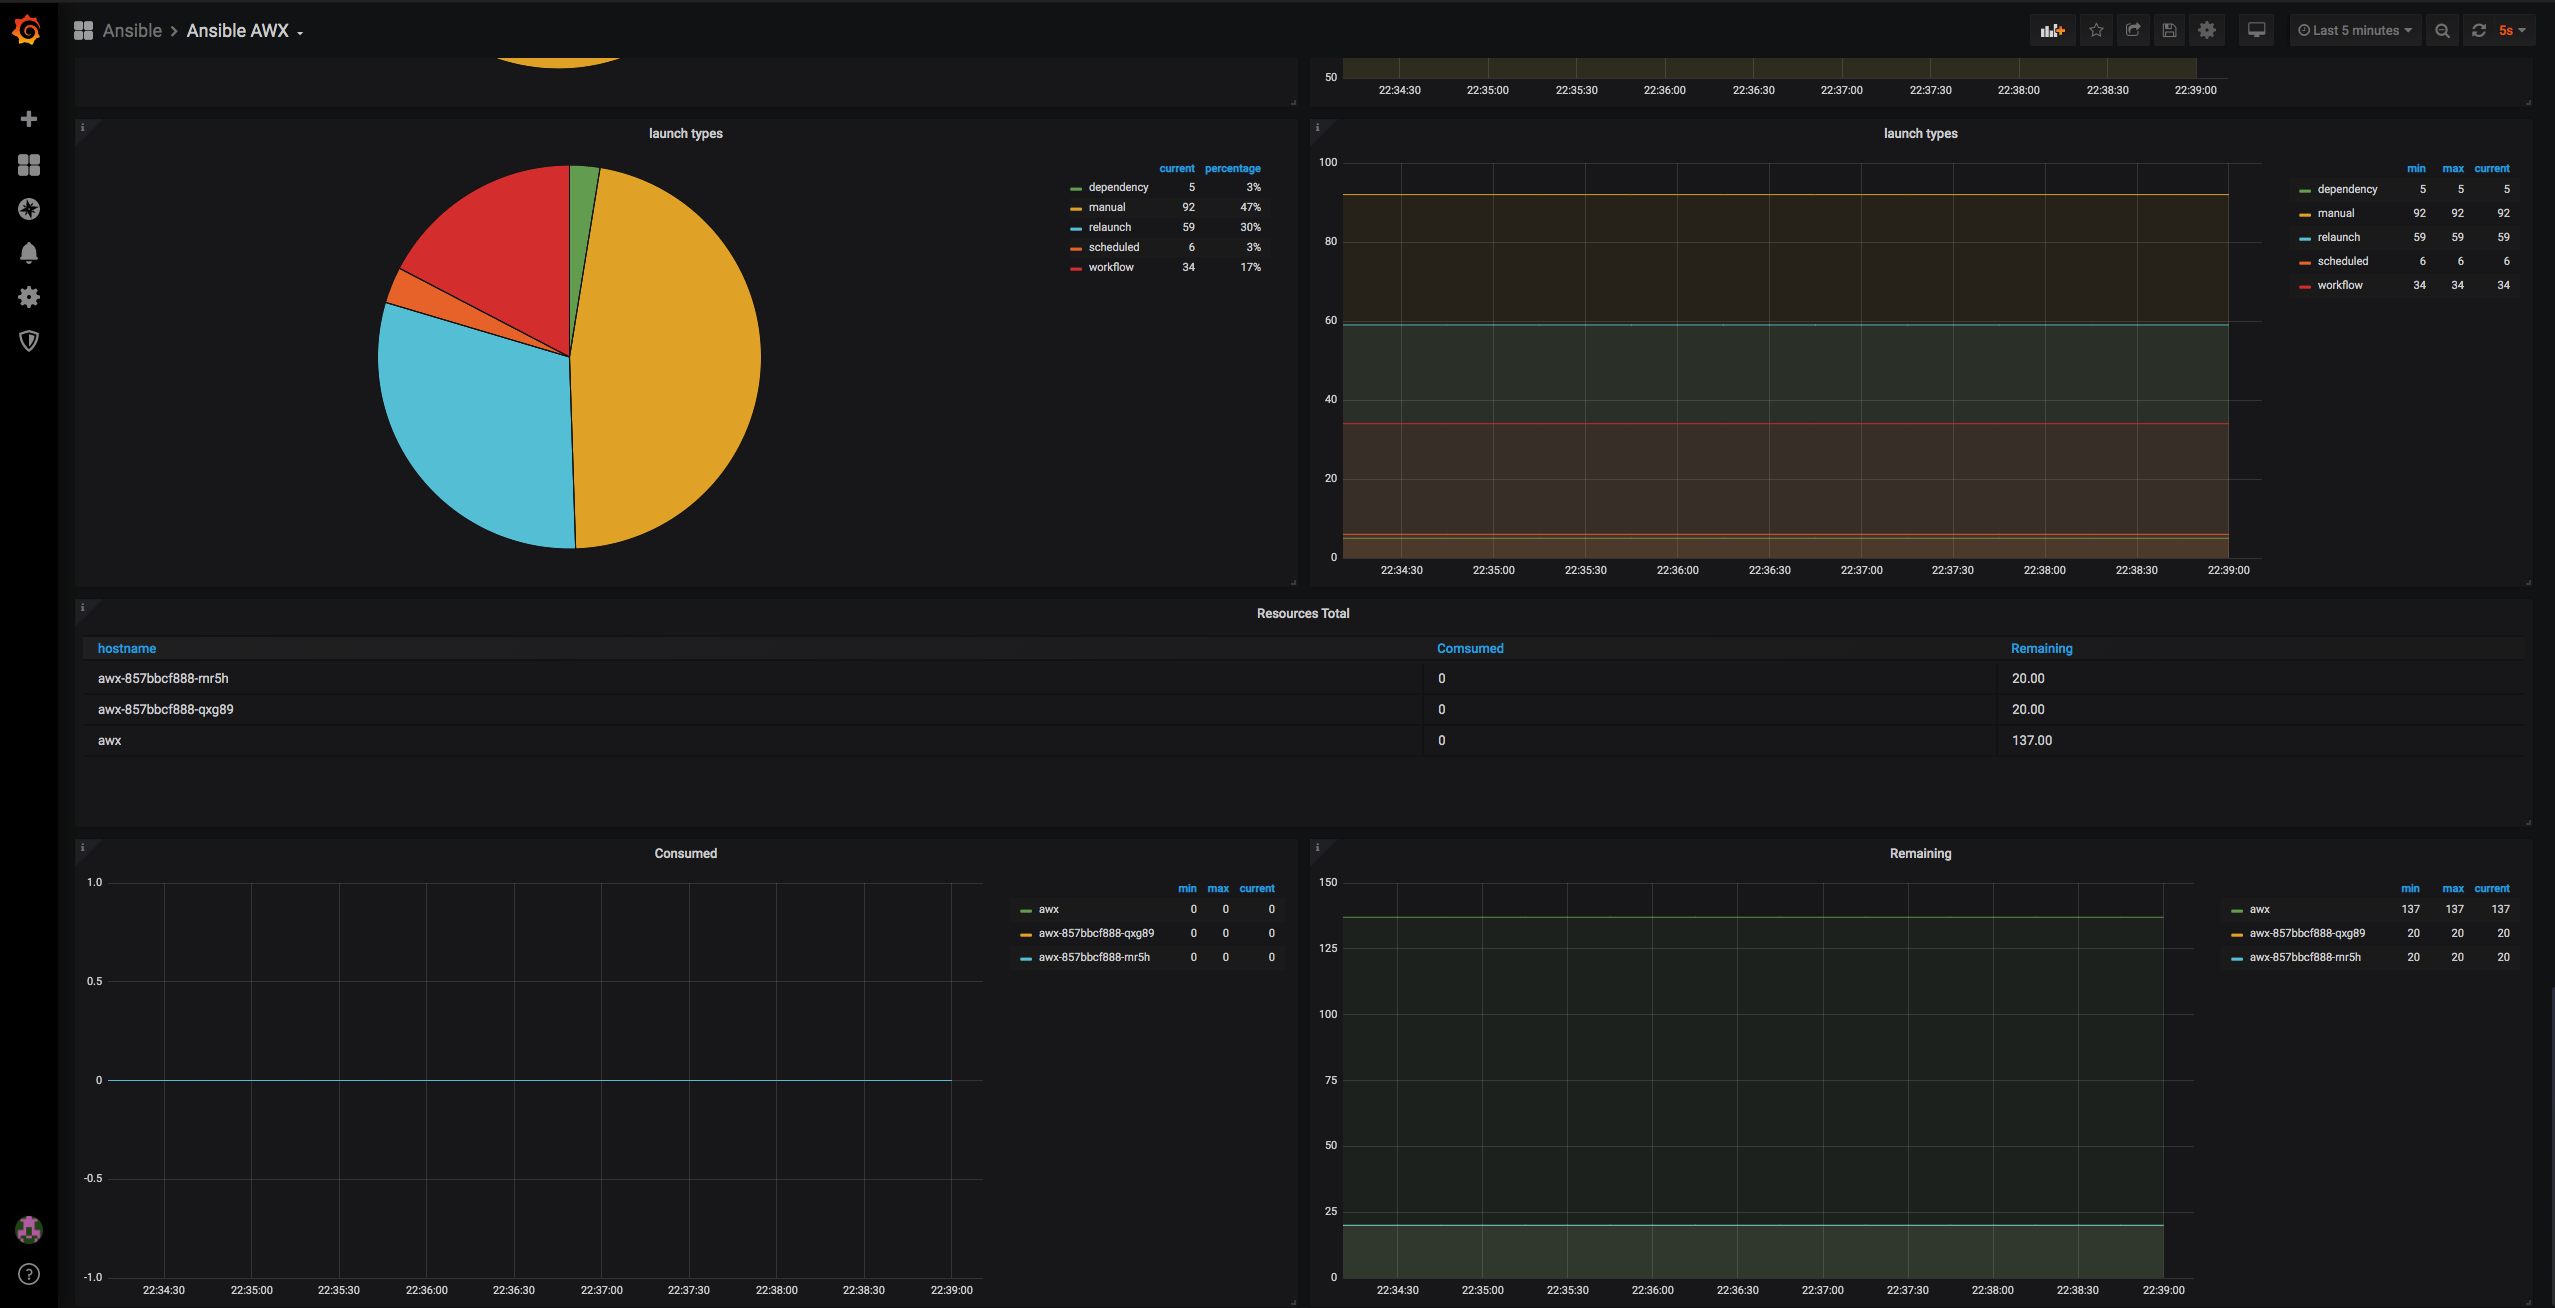
The Ansible AWX dashboard uses the prometheus data source to create a Grafana dashboard with the gauge, grafana-piechart-panel, graph and table panels.
Data source config
Collector type:
Collector plugins:
Collector config:
Revisions
Upload an updated version of an exported dashboard.json file from Grafana
| Revision | Description | Created | |
|---|---|---|---|
| Download |
AWX
Monitor AWX with Grafana. Easily monitor your AWX web app with Grafana Cloud's out-of-the-box monitoring solution.
Learn more