
Kubernetes Ingress Controller Dashboard
This Dashboard contains metrics visualization of Nginx Ingress Controller Running in Kubernetes Using Prometheus as Datasource.
Kubernetes Ingress Controller Dashboard
This Dashboard contains metrics visualization of Nginx Ingress Controller Running in Kubernetes Using Prometheus as Datasource. If you have prometheus and grafana installed on your cluster then prometheus will already be scraping this data due to the scrape annotation on the deployment.
Purpose of Each Panel using in Dashboard
Here you will see these information in dashboard
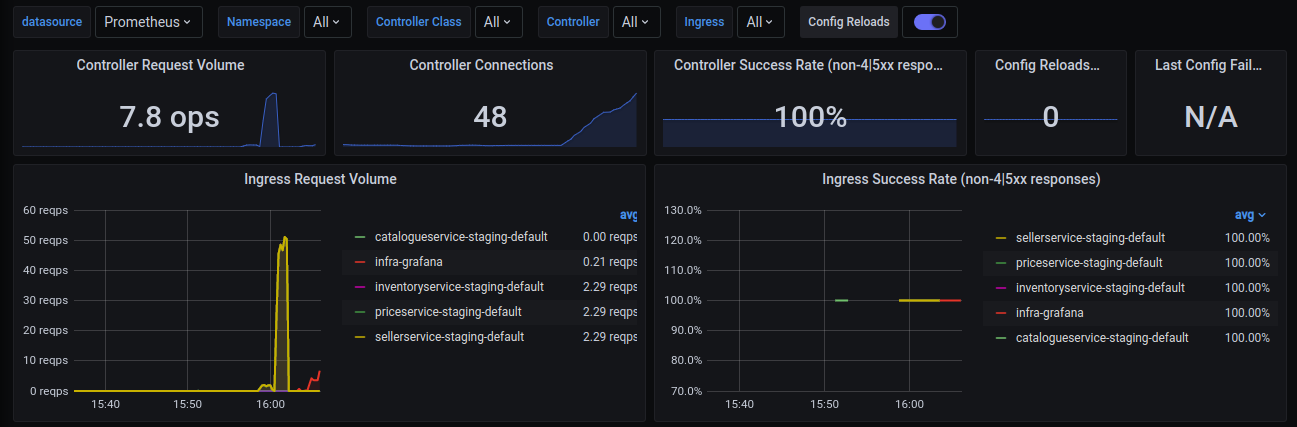
- Controller Request Volume
- Controller Connections
- Contoller Success Rate(non-4|5xx responses)
- Config Reloads
- Last Config Failed
- Ingress Request Volume
- Ingress Success Rate (non-4|5xx responses)
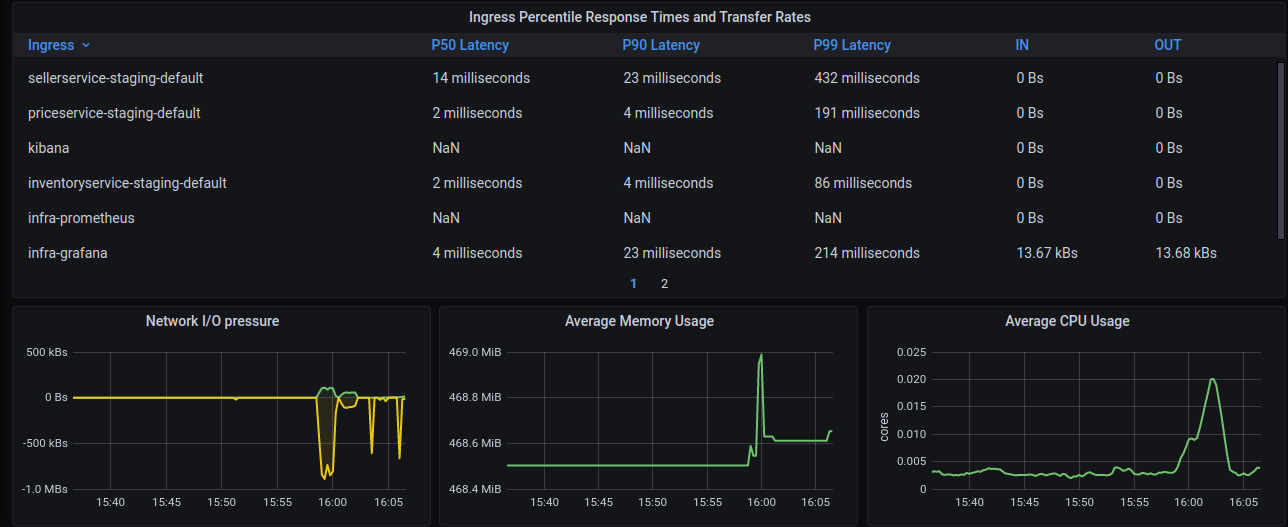
- Ingress Percentile Response Times and Transfer Rates
- Network I/O Pressure
- Average Memory Usage
- Average CPU Usage
Data source config
Collector type:
Collector plugins:
Collector config:
Dashboard revisions
Upload an updated version of an exported dashboard.json file from Grafana
| Revision | Decscription | Created | |
|---|---|---|---|
| Download |
Sign up for Grafana Cloud

Get up and running in minutes with the Grafana Cloud free tier, which includes free forever 10k metrics, 50GB logs, 50GB traces, 500 VUh, and more.
Get this dashboard
Data source:
Dependencies: