
Mongo DB
A Mongodb Replication Performance Monitoring with Prometheus and telegraf agent
Mongodb Dashboard
Mongodb Dashboard Visualization uses ![]() as an exporter. This dashboard will work Effeciently if replication is enabled in MongoDB Cluster.
as an exporter. This dashboard will work Effeciently if replication is enabled in MongoDB Cluster.
These Dashboards need mongodb as Telegraf Input Plugins, You can find the Mongodb Input Plugin Configuration below
[[inputs.mongodb]]
  ## An array of URLs of the form:
  ##   "mongodb://" [user ":" pass "@"] host [ ":" port]
  ## For example:
  ##   mongodb://user:auth_key@10.10.3.30:27017,
  ##   mongodb://10.10.3.33:18832,
  servers = ["mongodb://127.0.0.1:27017"]
Purpose of Each Panel Used in Dashboard
Here you will see these information in dashboards
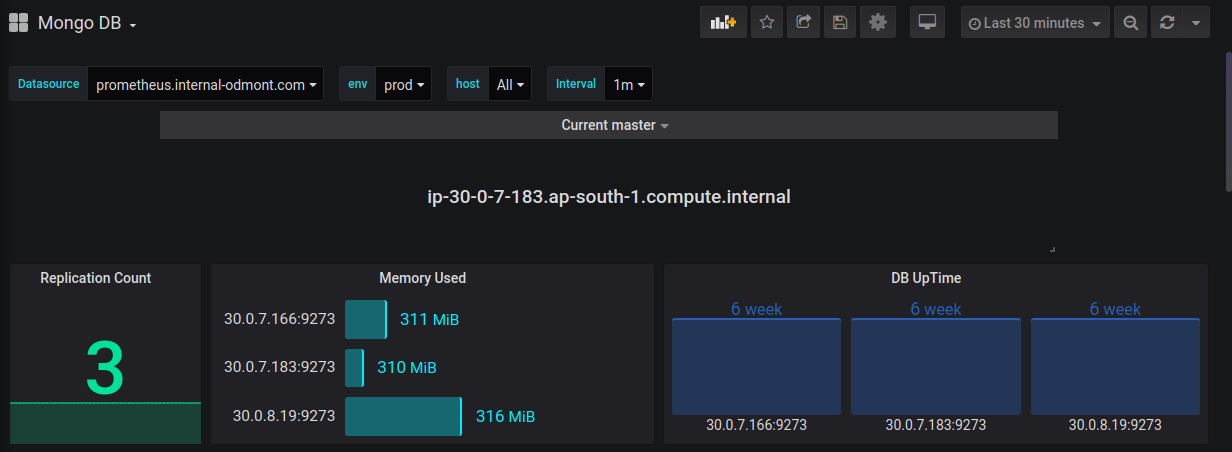
- Current Master from Mongo replica Set
- Total Replication count
- Memory used by node
- MongoDb Uptime
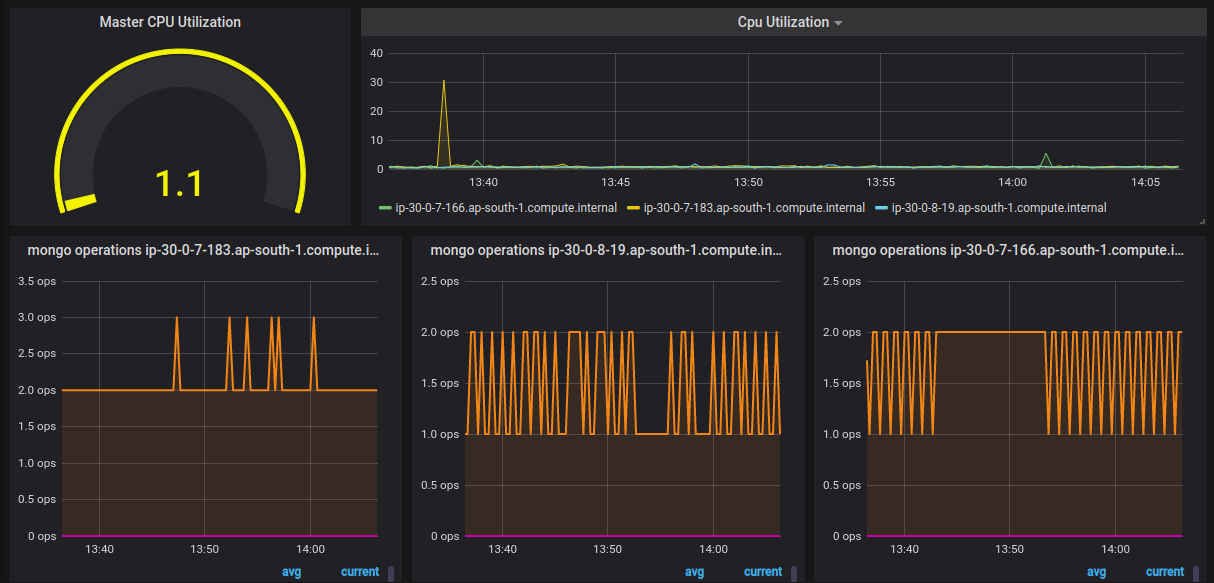
- Master CPU Utilization
- CPU Utilization in each node
- Total operations (read,write,update,delete)
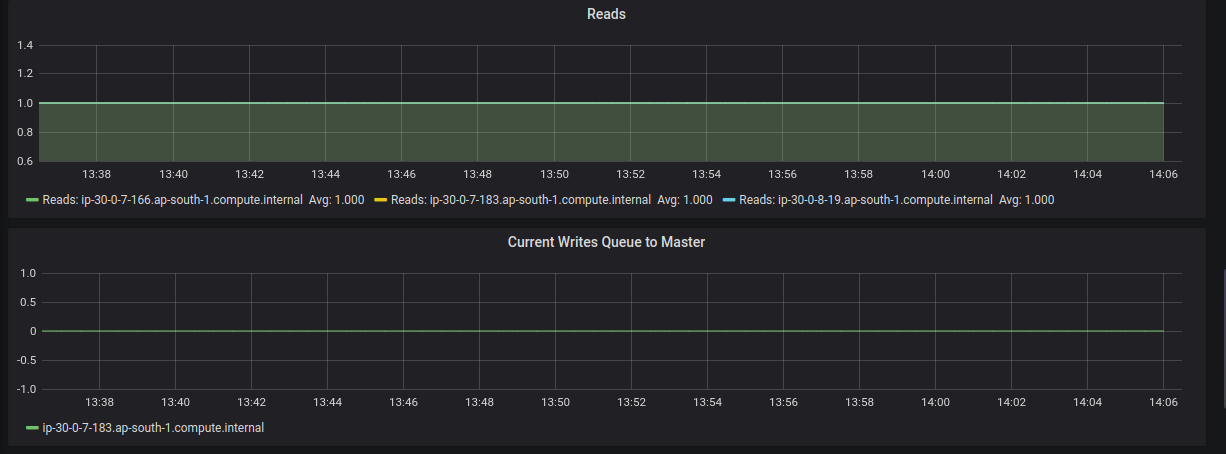
- Total Read operations
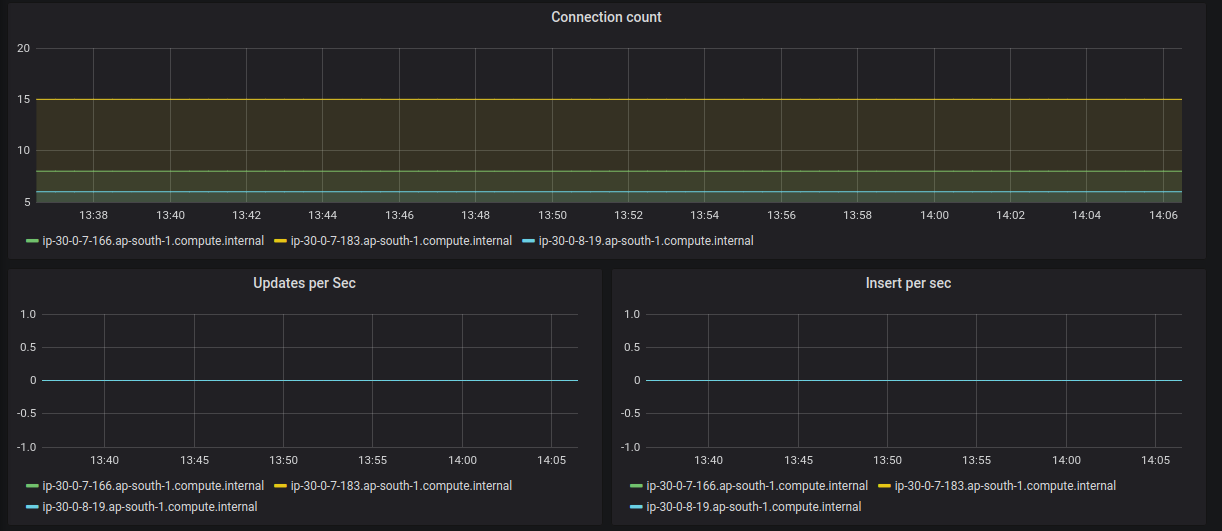
- Total Write operations
- Total Update operations
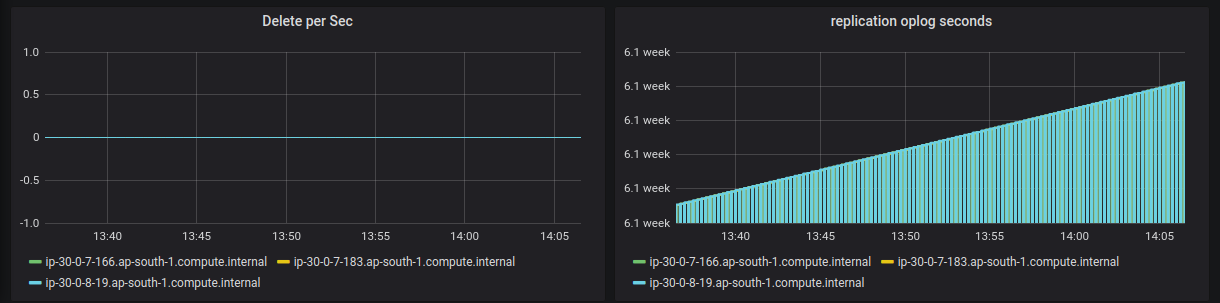
- Total Delete operations
Contributor Information
Data source config
Collector type:
Collector plugins:
Collector config:
Revisions
Upload an updated version of an exported dashboard.json file from Grafana
| Revision | Description | Created | |
|---|---|---|---|
| Download |
Azure Cosmos DB
With the Grafana plugin for Azure Cosmos DB, you can quickly visualize and query your Azure Cosmos DB data from within Grafana.
Learn more