
Redis Server
A Redis Server Performance Monitoring Redis Server with Prometheus and telegraf agent using Redis agent
Redis Dashboard
This Dashboard Monitor Redis using Prometheus as Data Source and telegraf as an agent using the Redis input plugin.
Redis Plugin Configuration
[[inputs.redis]]
  servers = ["tcp://redis:6379"]
##  e.g.
  ##    tcp://localhost:6379
  ##    tcp://:password@192.168.99.100
For more information on configuration and metrics detail of redis input plugin please click here
dashboard Panels
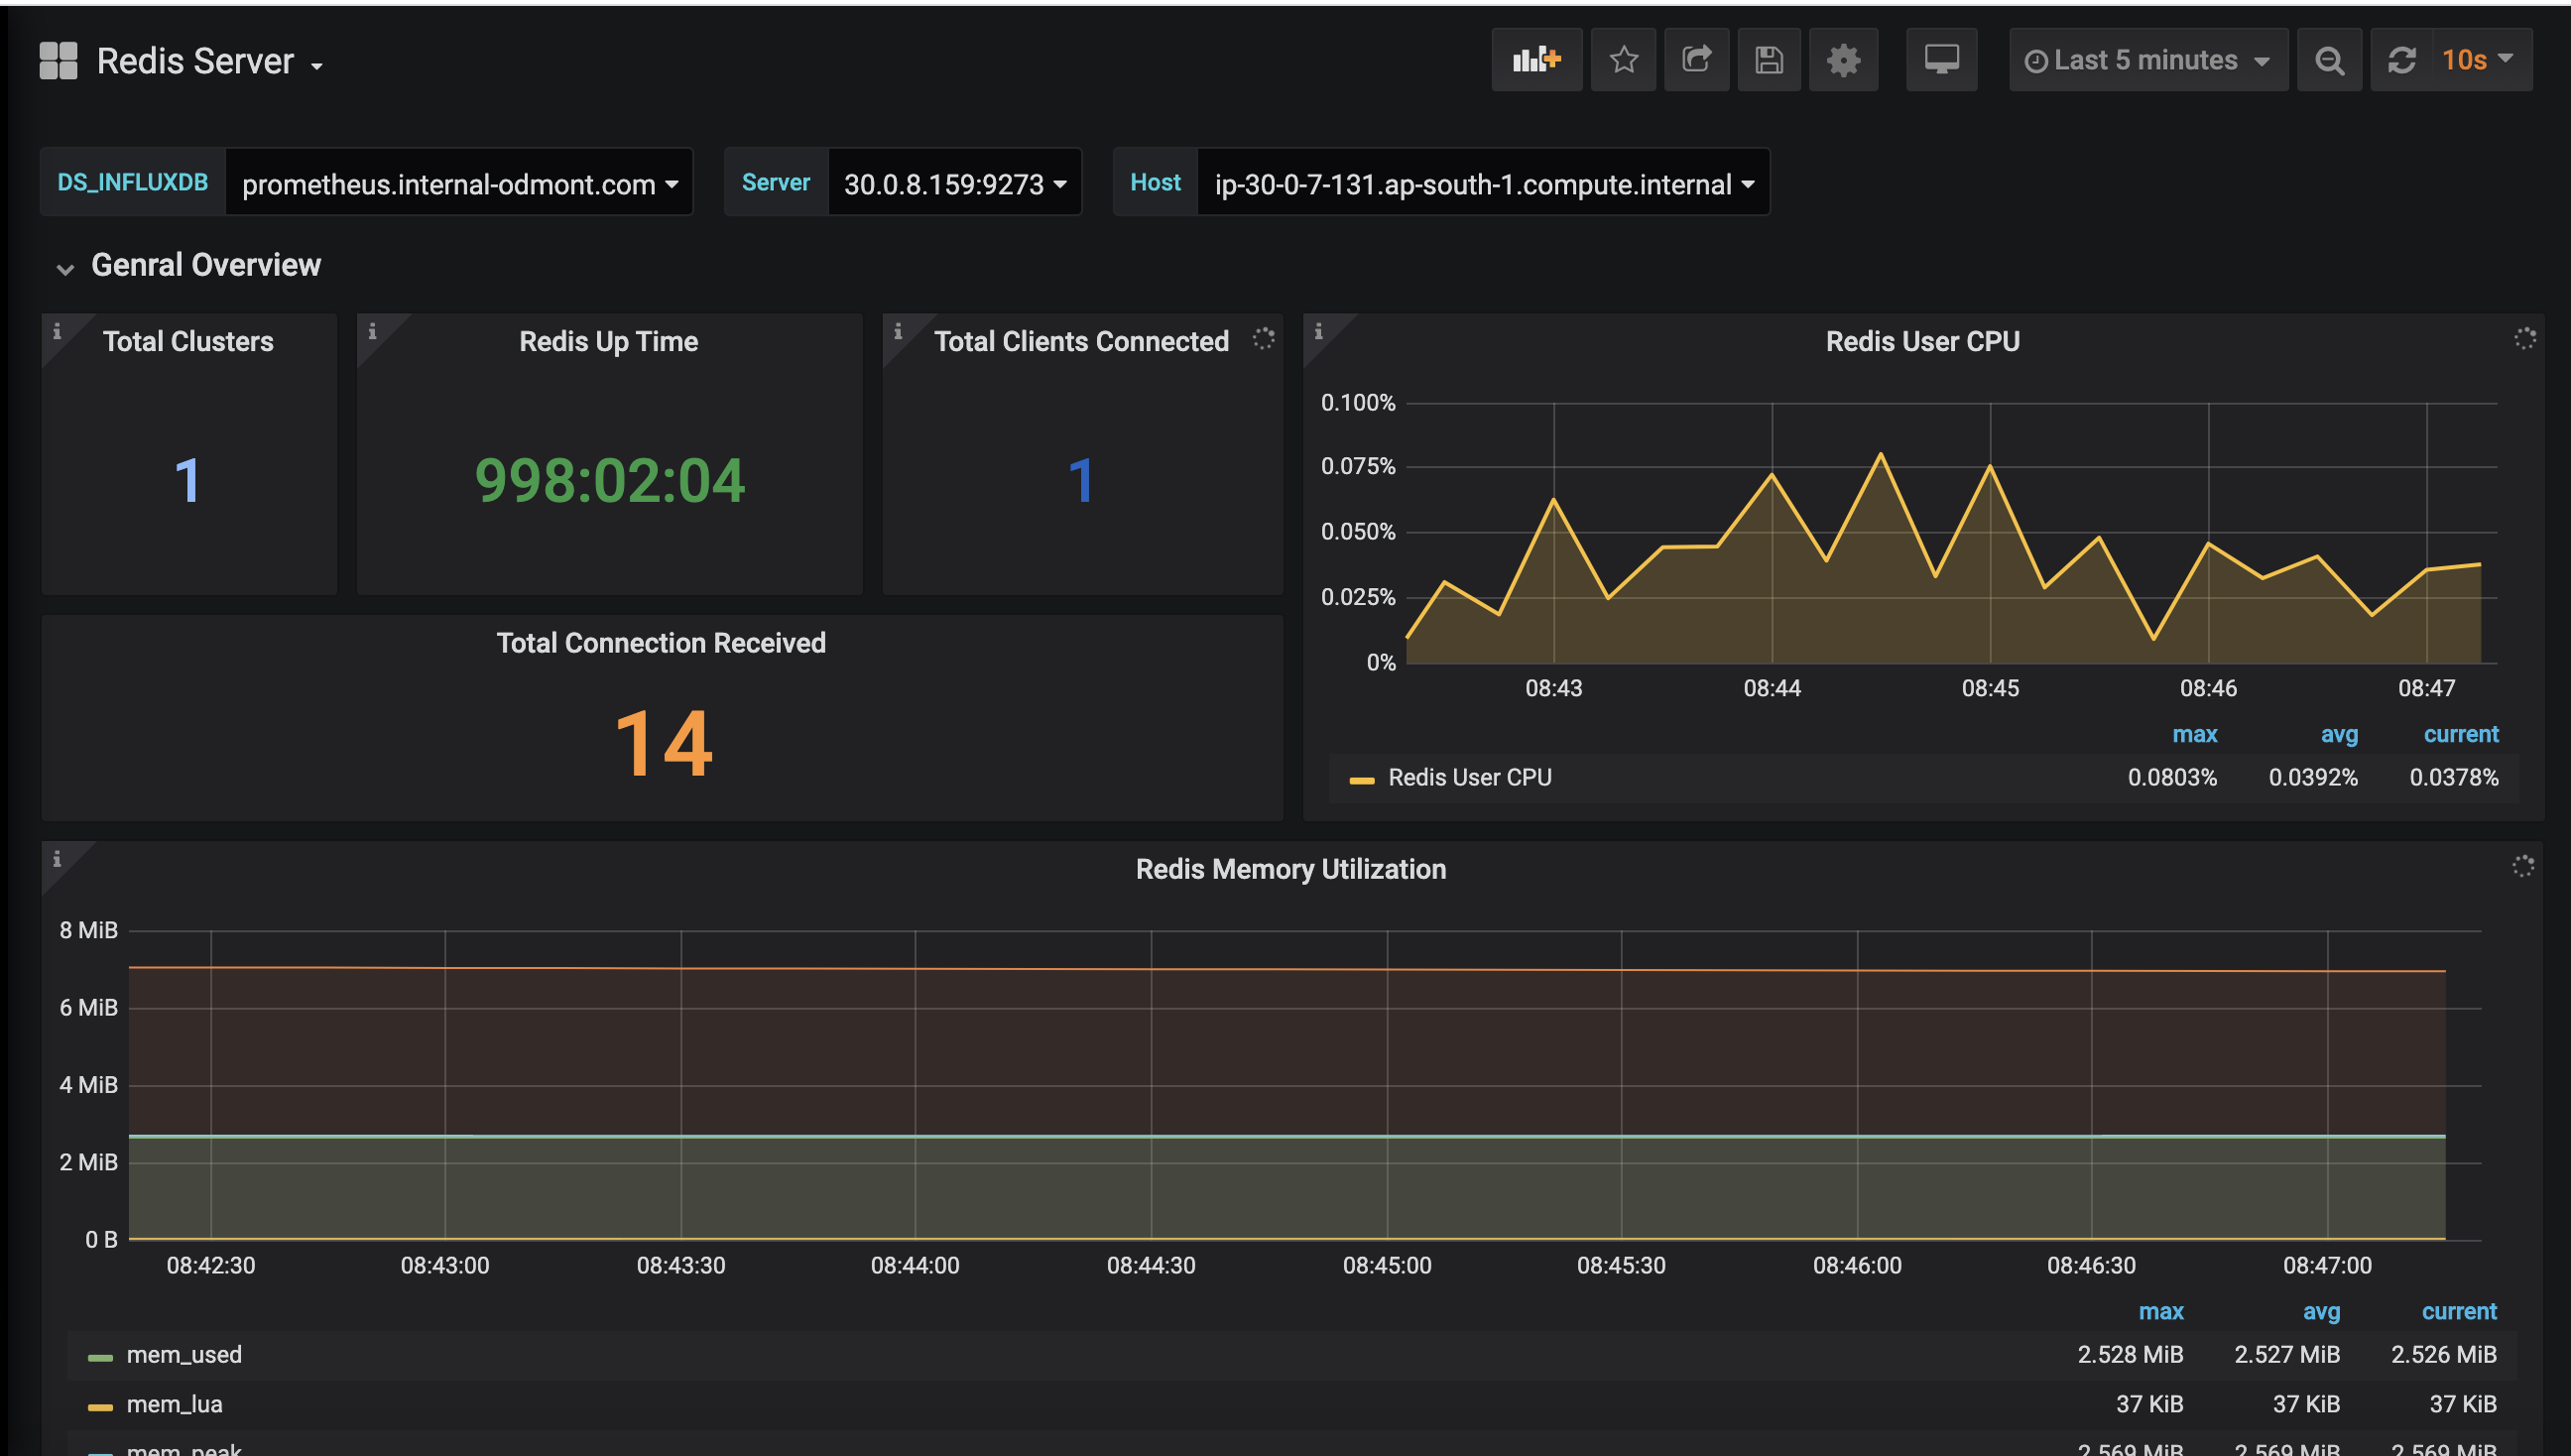
- Total Clusters
- Redis Up Time
- Total Clients Connected
- Total Connection Received
- Redis User CPU Usage
- Redis Memory Utilization
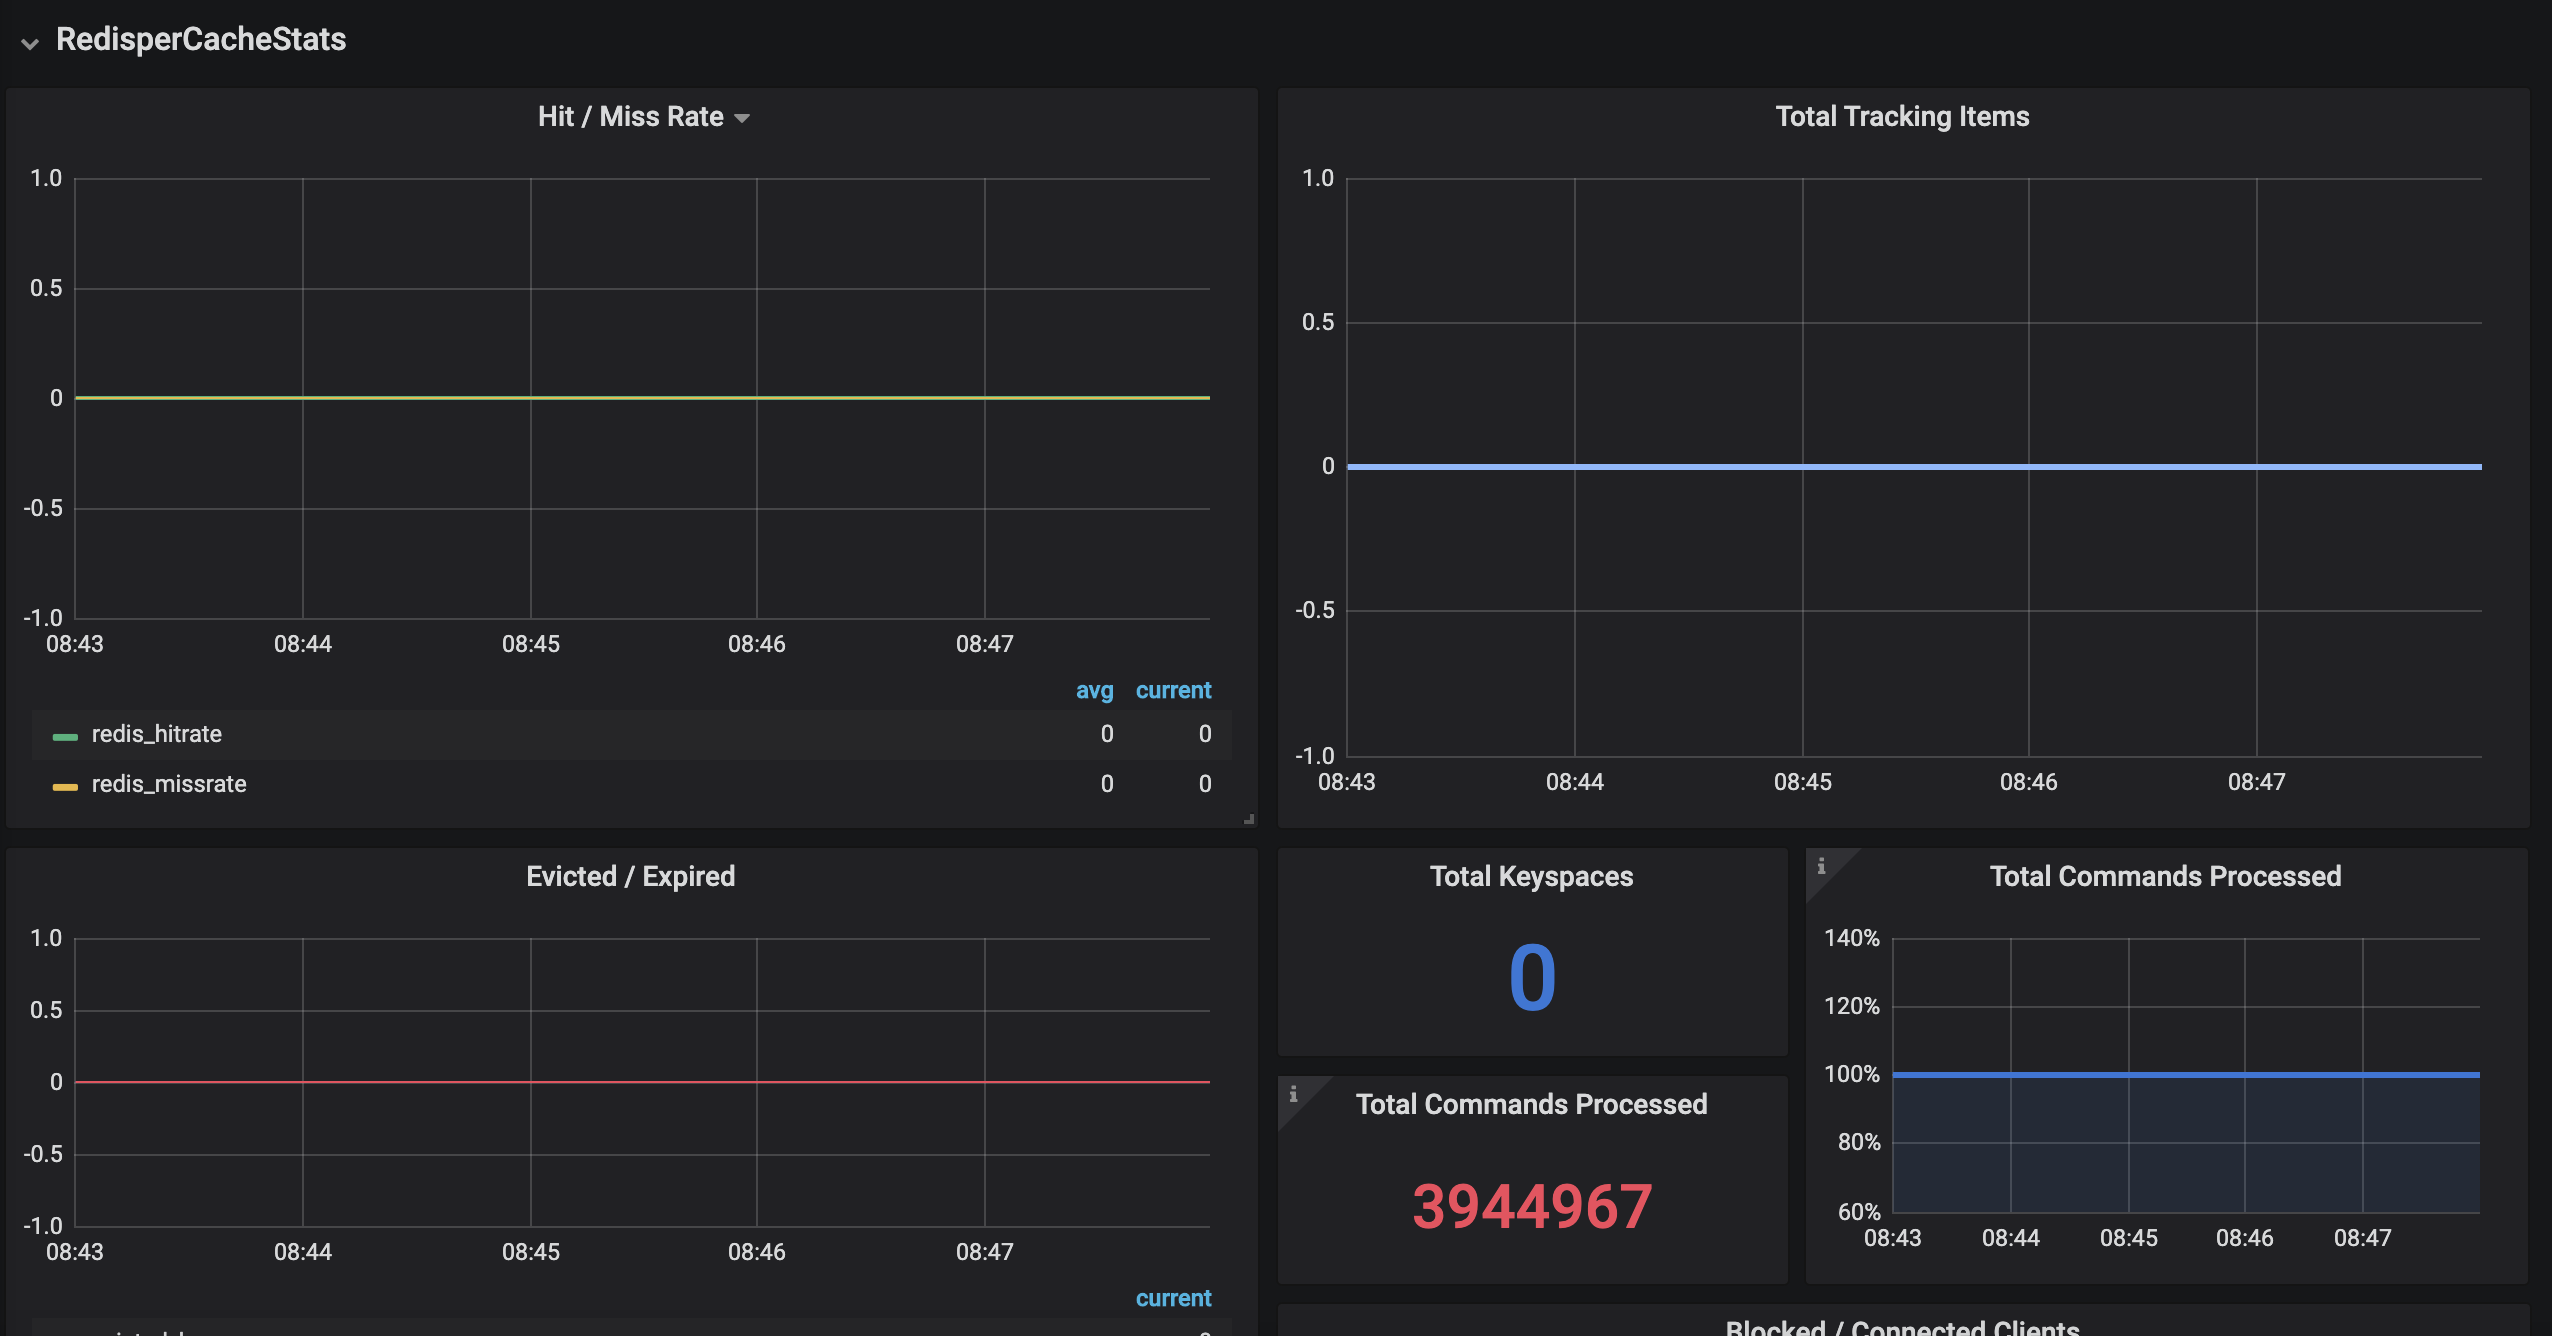
- Hit/Miss Rate
- Total Tracking Items
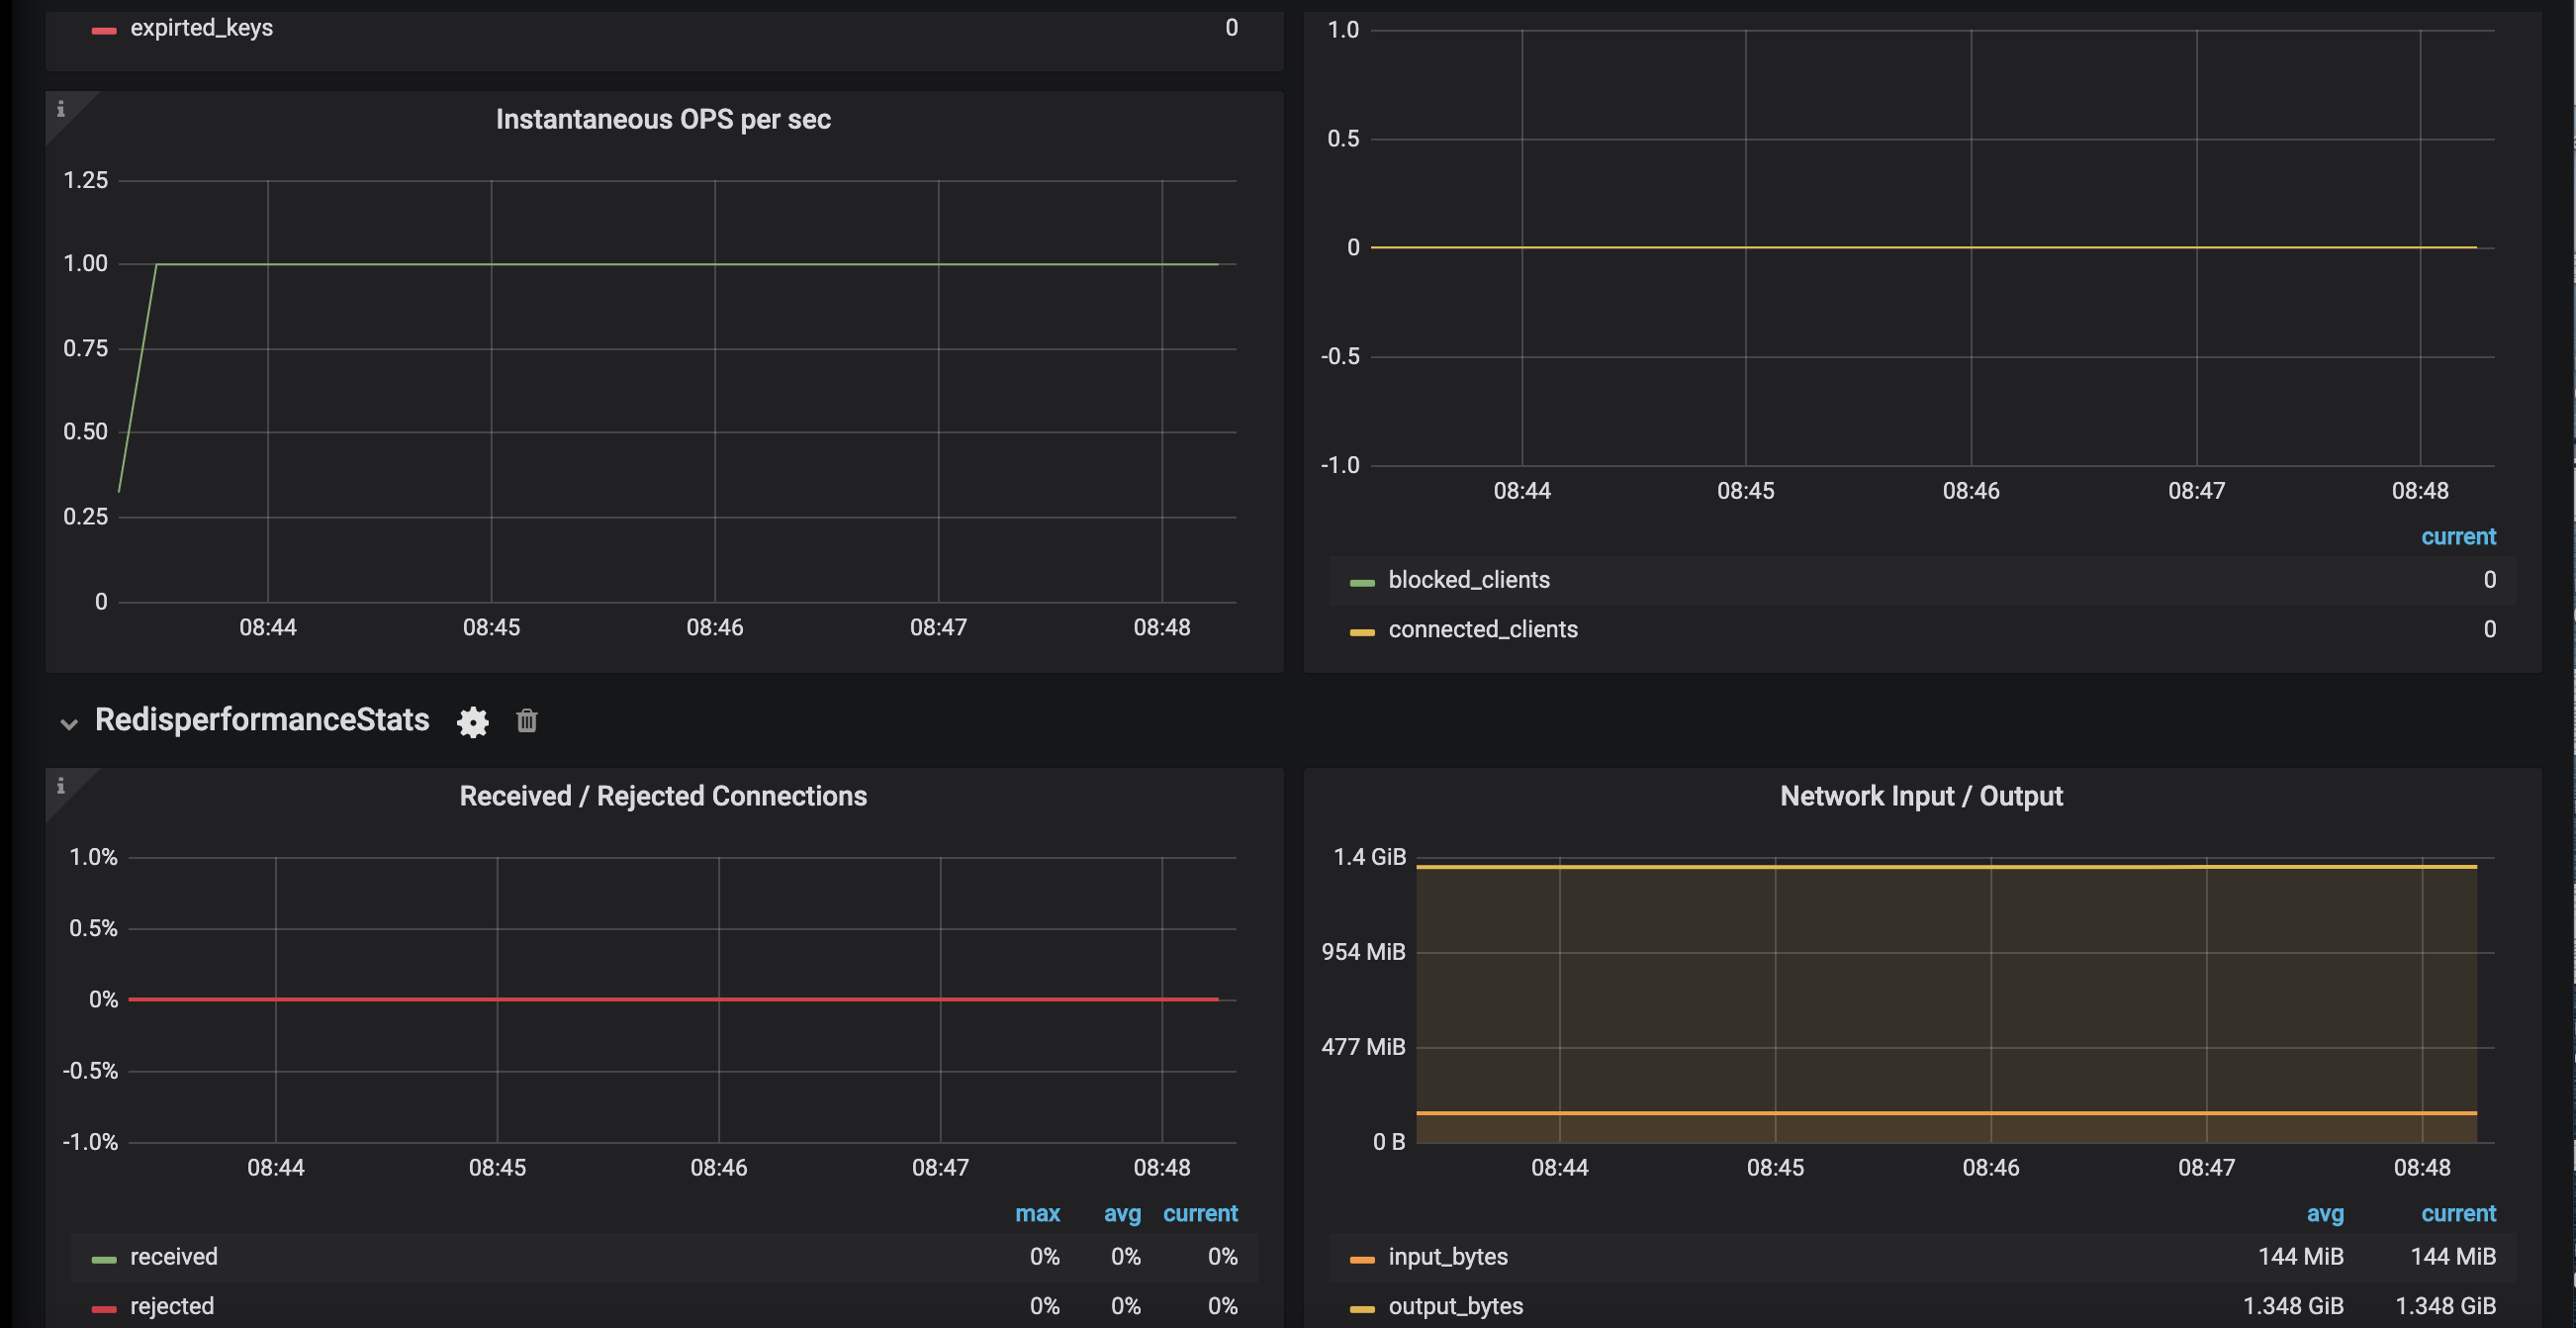
- Evicted/Expired Keys
- Total Keyspaces
- Total Commands Processed
- Total Connected Processed
- Instantaneous OPS Per Sec
- Received/Rejected Connections
- Network Input/Output
Contributer Information
Data source config
Collector type:
Collector plugins:
Collector config:
Dashboard revisions
Upload an updated version of an exported dashboard.json file from Grafana
| Revision | Decscription | Created | |
|---|---|---|---|
| Download |
Sign up for Grafana Cloud

Get up and running in minutes with the Grafana Cloud free tier, which includes free forever 10k metrics, 50GB logs, 50GB traces, 500 VUh, and more.
Get this dashboard
Data source:
Dependencies: