System Informationn
System Information Dashboard provides information about the node
Telegraf Input Plugins
Following are the basic telegraf Configuration can be use.
[global_tags]
Configuration for telegraf agent
[agent]
interval = "10s"
debug = false
hostname = "theone.us-central1-a.c.theone-277307.internal"
round_interval = true
flush_interval = "10s"
flush_jitter = "0s"
collection_jitter = "0s"
metric_batch_size = 1000
metric_buffer_limit = 10000
quiet = false
logfile = "/var/log/telegraf/telegraf.log"
omit_hostname = false
###############################################################################
OUTPUTS
###############################################################################
[[outputs.prometheus_client]]
listen = ":9273"
###############################################################################
INPUTS
###############################################################################
[[inputs.cpu]]
percpu = true
[[inputs.disk]]
[[inputs.io]]
[[inputs.mem]]
[[inputs.net]]
[[inputs.system]]
[[inputs.swap]]
[[inputs.netstat]]
[[inputs.processes]]
[[inputs.kernel]]
[[inputs.diskio]]
[[inputs.procstat]]
user = "root,telegraf,ubuntu"
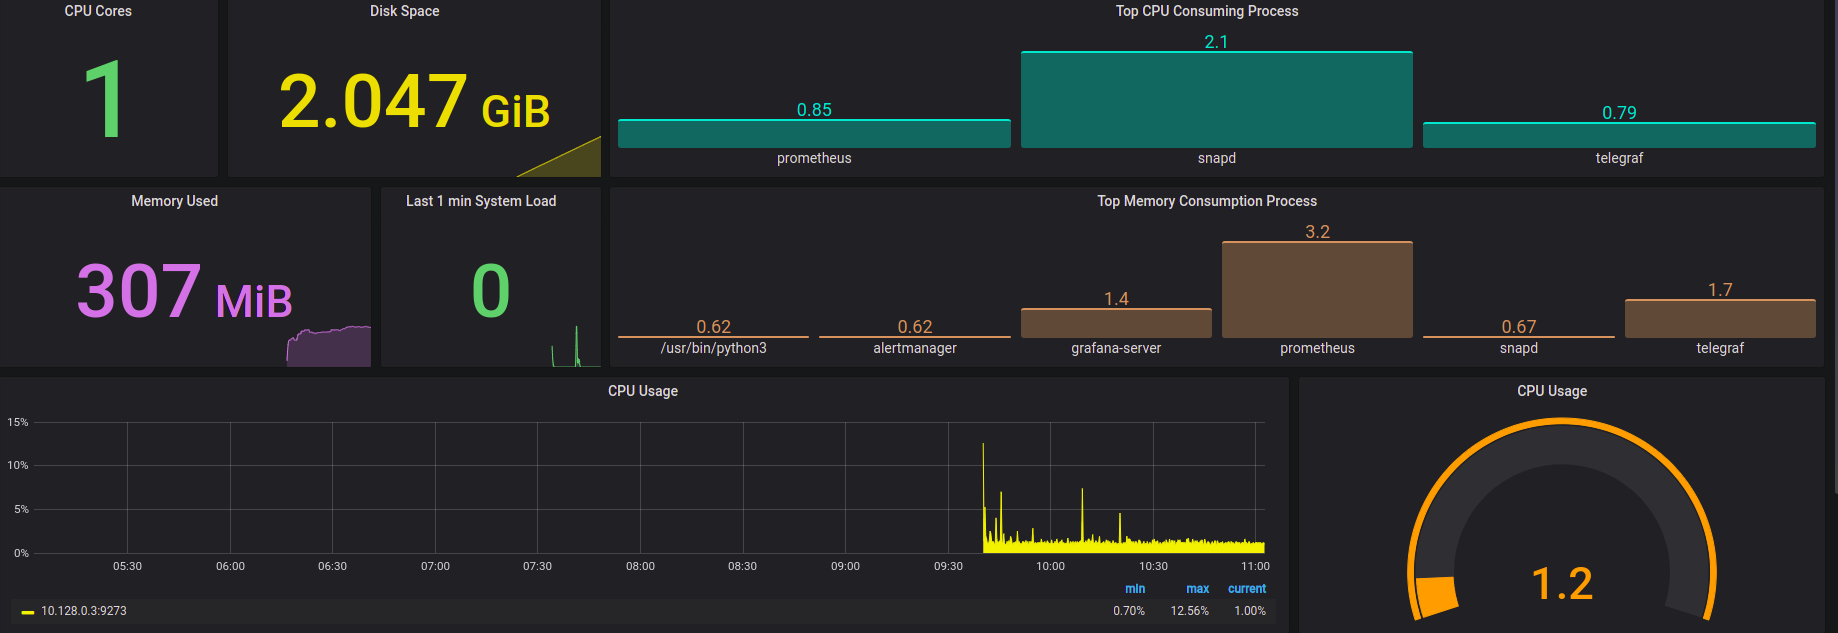
Panels using in Dashboard
- Number of CPU Cores of node.
- OS Disk Space Used Currently.
- Currently Memory Using.
- Last 1 min System Load.
- Top CPU Consuming Process running on node.
- Top Memory Cunsuming Prcess running on node.
- CPU Utilization.
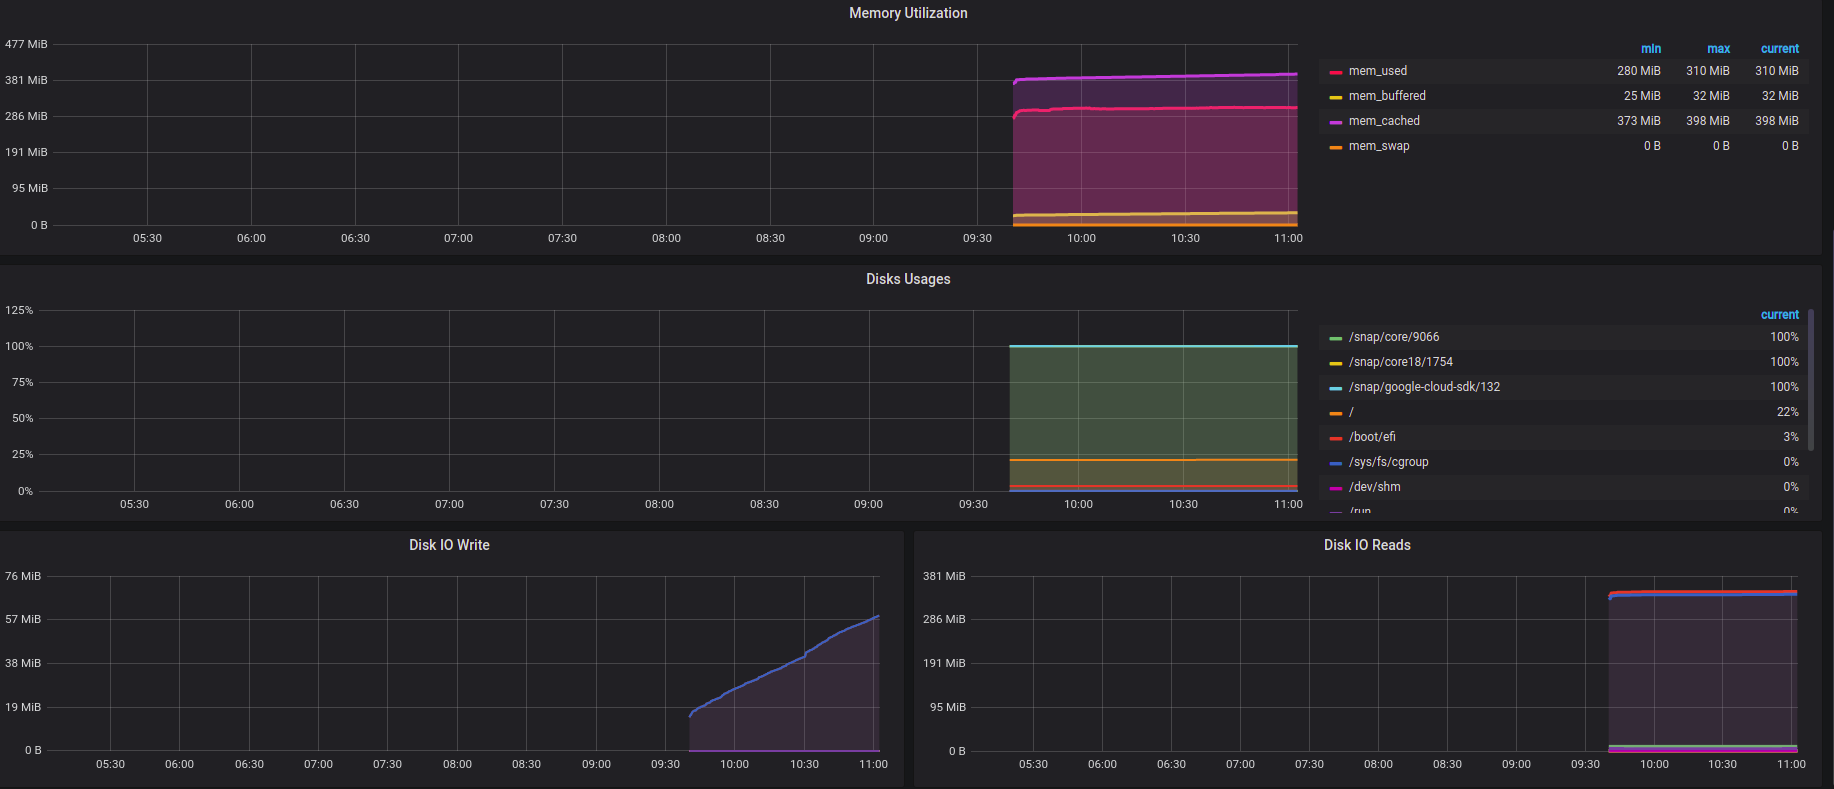
- Memory Utilization.
- Disk Space usages on each mount point.
- Disk IO Write.
- Disk IO READ.
- Network Input
- Network Output
Contributor Information
Data source config
Collector config:
Upload an updated version of an exported dashboard.json file from Grafana
| Revision | Description | Created | |
|---|---|---|---|
| Download |