Solr Dashboard
Default dashboard for Solr Exporter
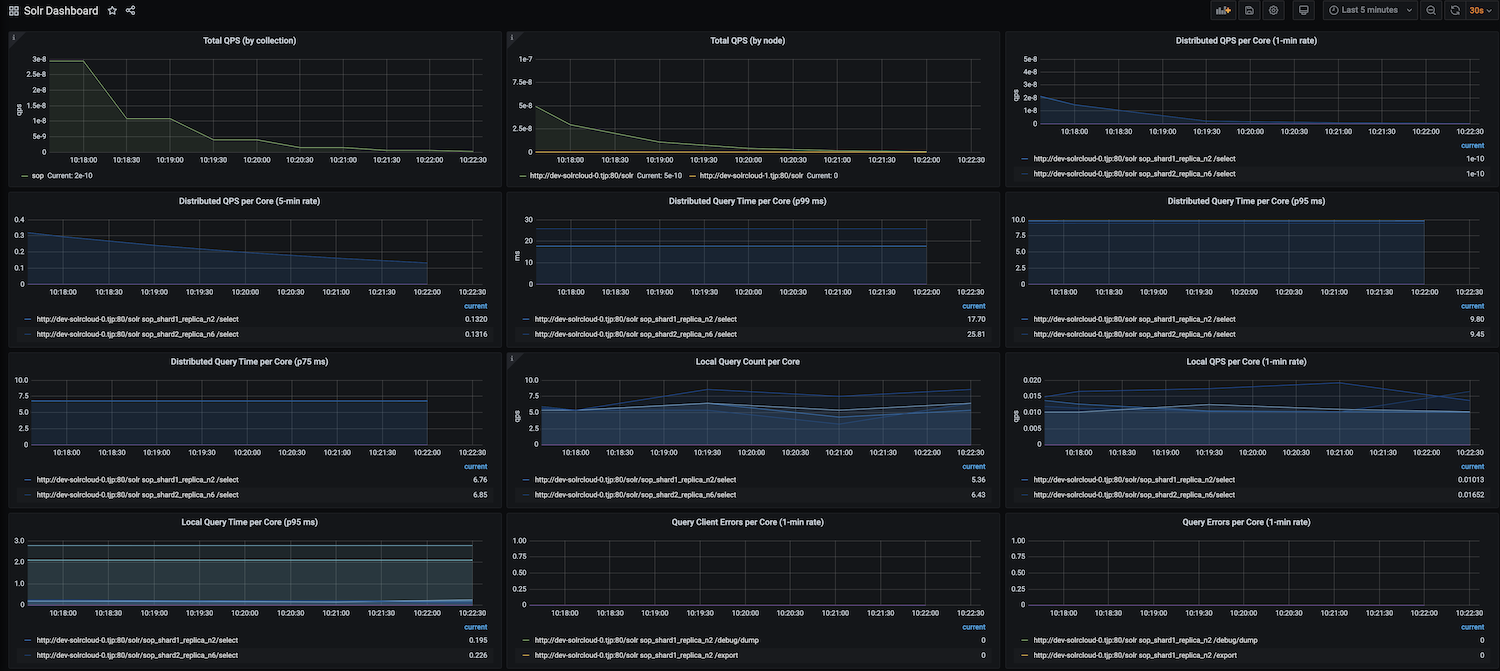
This is a Grafana dashboard that works OOTB with the Solr Prometheus Exporter. See https://solr.apache.org/guide/monitoring-solr-with-prometheus-and-grafana.html for setup instructions.
The dashboard shows a selection of metrics from
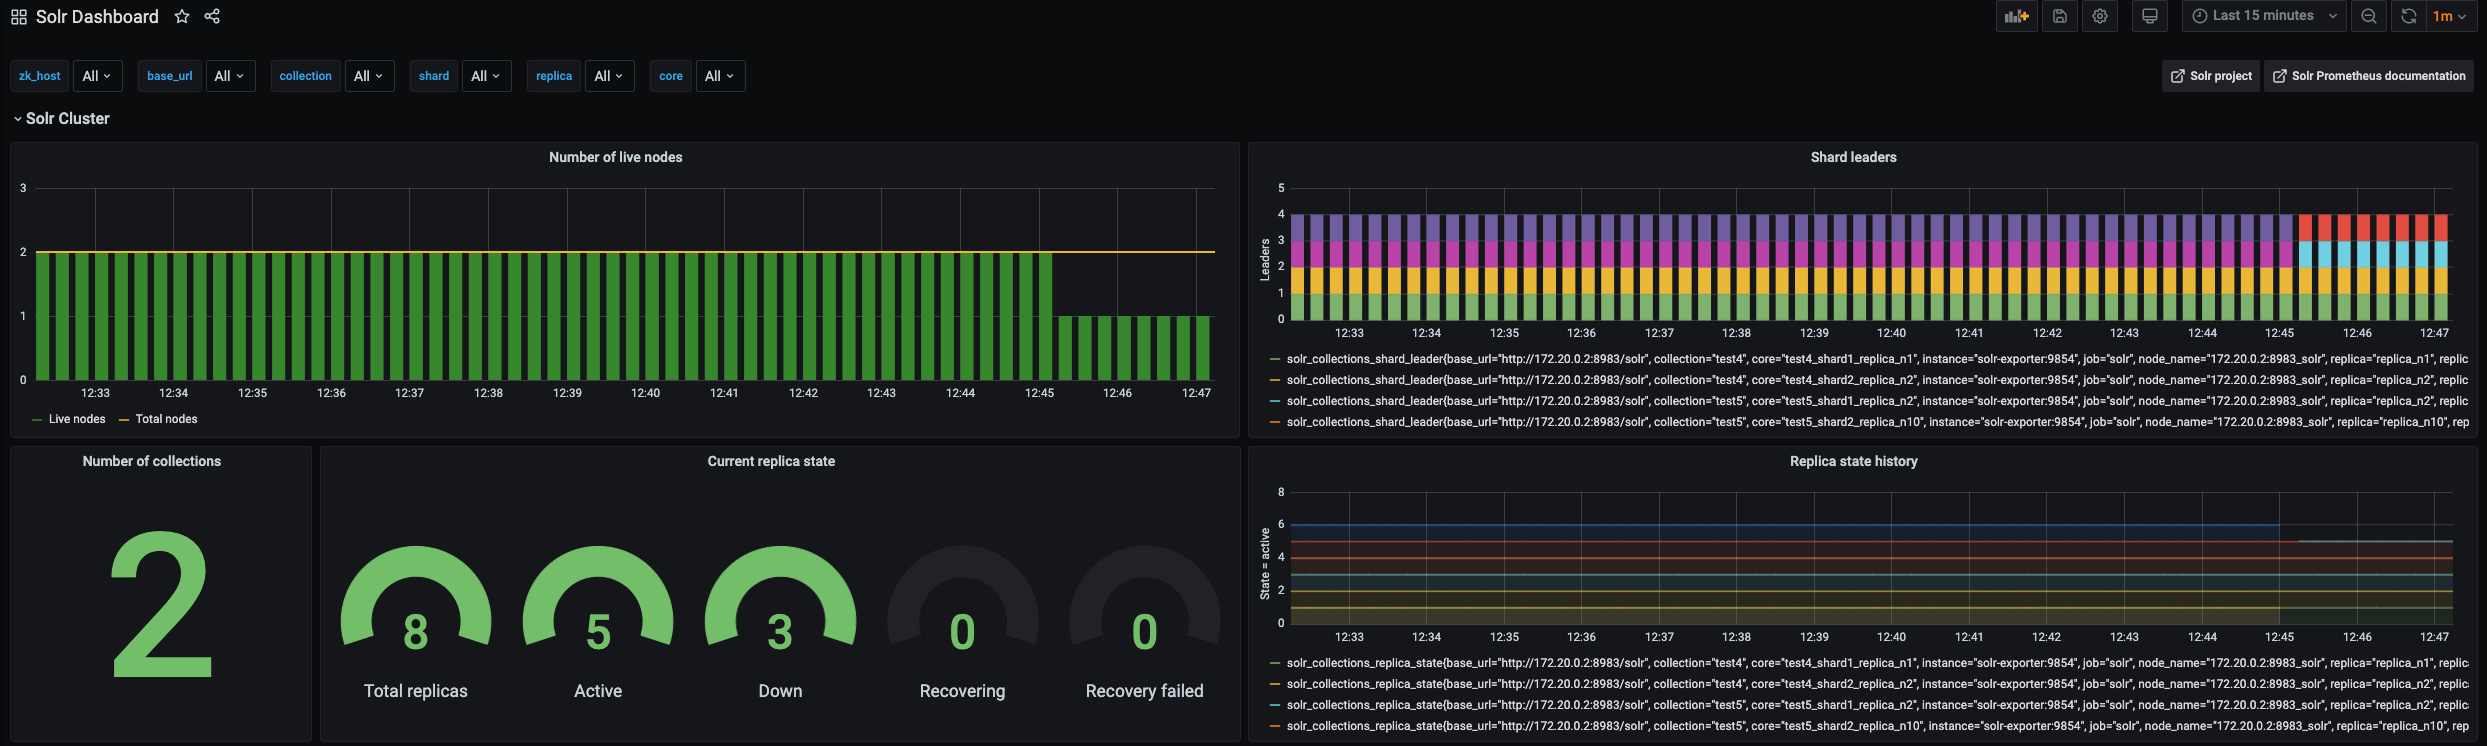
- Solr cluster-level overview
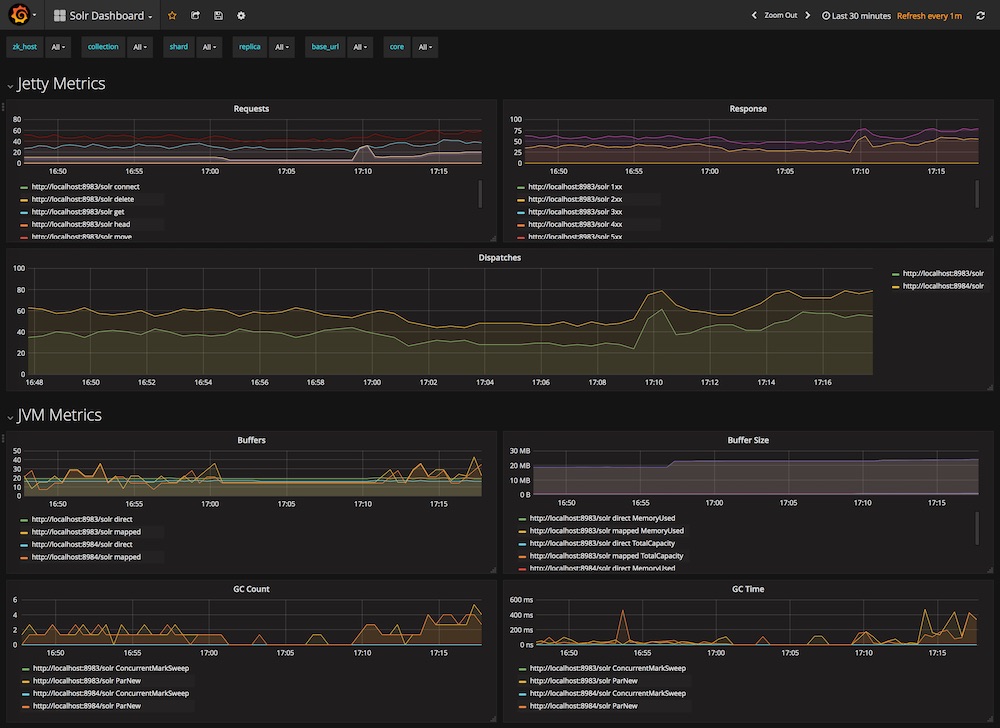
- Jetty (request etc)
- the Java VM (memory, GC etc)
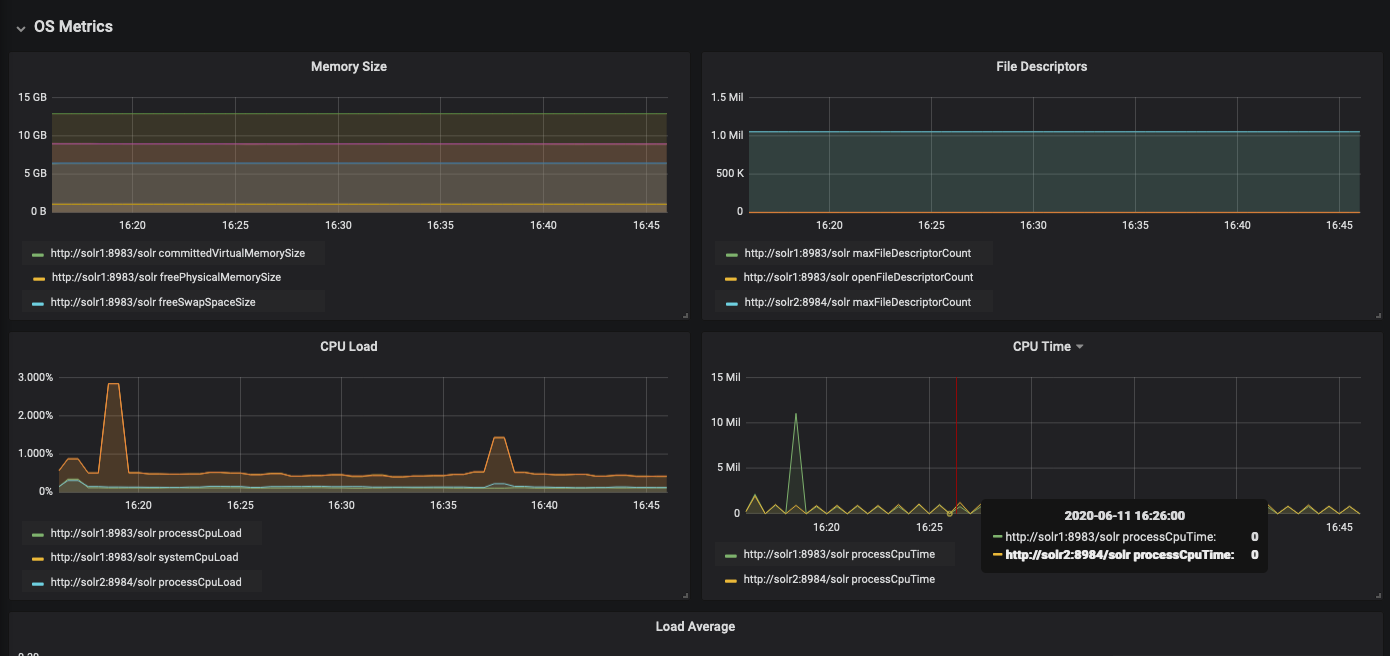
- OS metrics (memory, cpu disk etc)
- Solr node (number of cores, threads etc)
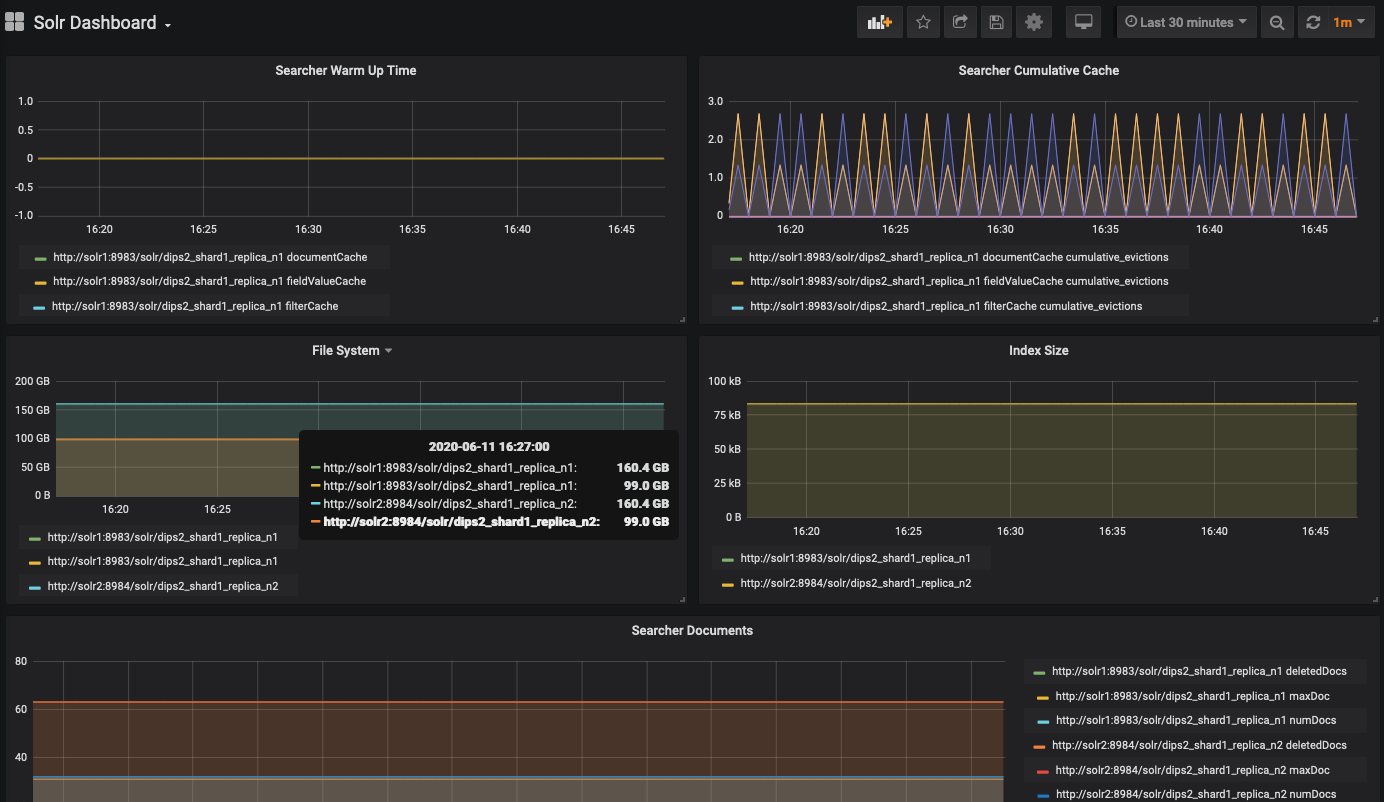
- Solr Core metrics (index size, num docs etc)
Changelog:
- April 2021: New Solr Cluster row on top, showing number of live nodes, collections, shard status and shard leaders.
- January 2021: New Query metrics row, showing QPS metrics per collection (requires solr-exporter 8.8 or later)
- October 2020 version: Now the collection, shard, replica, core dropdowns on top actually filter the graphs!
Data source config
Collector type:
Collector plugins:
Collector config:
Revisions
Upload an updated version of an exported dashboard.json file from Grafana
| Revision | Description | Created | |
|---|---|---|---|
| Download |
Apache Solr
Easily monitor Apache Solr, an open source search platform built on Apache Lucene, with Grafana Cloud's out-of-the-box monitoring solution.
Learn more