Cisco ACI
Monitor Cisco ACI via REST API
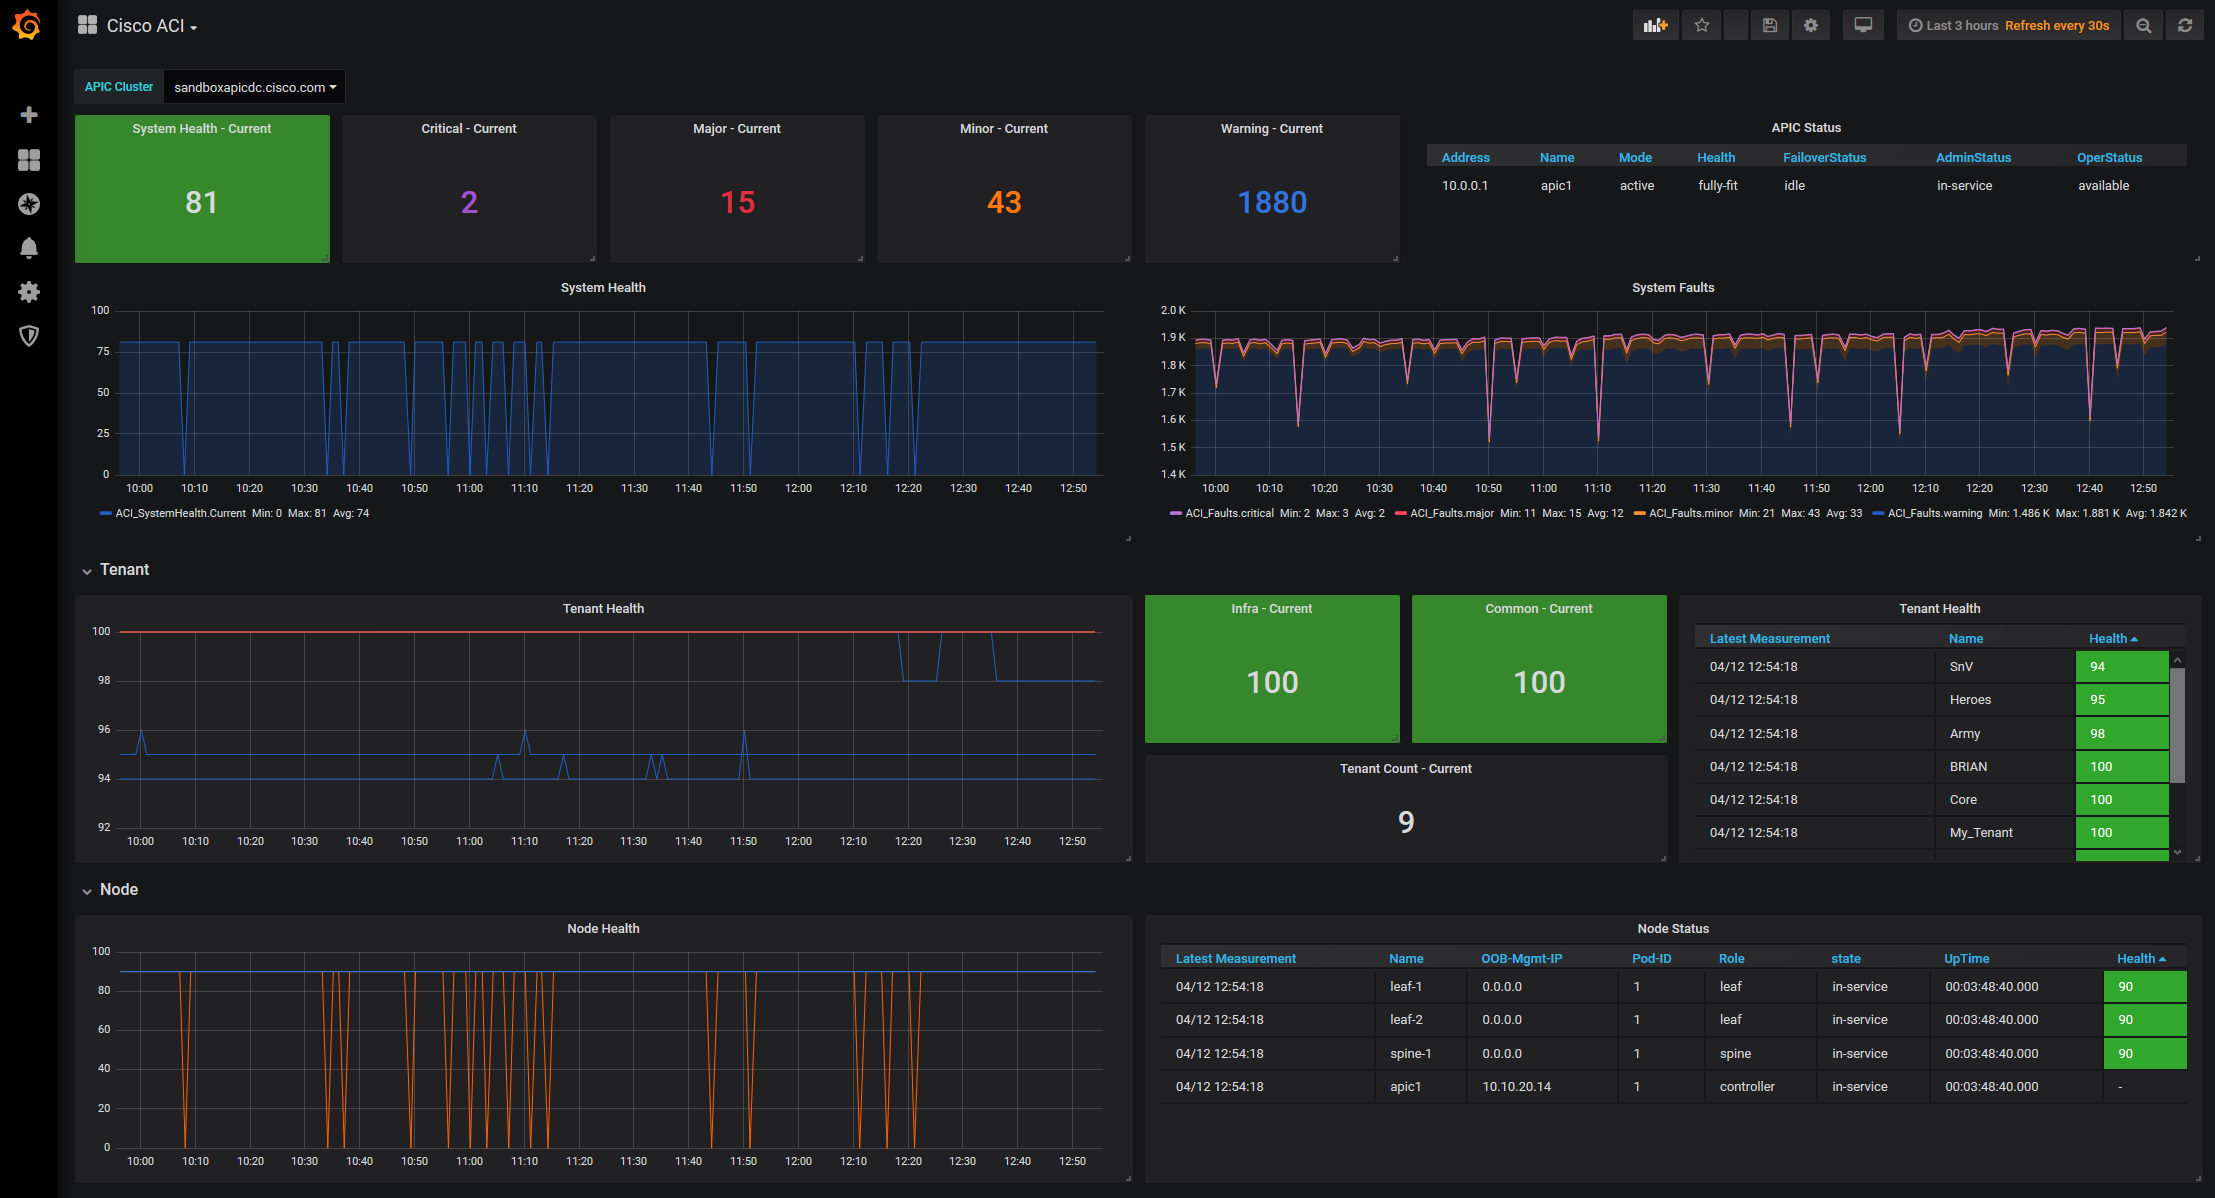
CiscoACI_Grafana
Demo about how to monitor Cisco ACI via REST-API with the TIG-Stack (Telegraf, InfluxDB, Grafana).
Visit GitHub CiscoACI_Grafana or my blog post over at NWMichl Blog for Telegraf configuration files and full documentation.
Shell scripts
apic_query.sh and apic_querysig.sh may live in the /etc/telegraf directory and provide a wrapper around the API Call. Telegraf inputs.http doesn't support cookie handling, so I choose to break out to bash and use inputs.exec to parse the json response. Same for the cert / signature based authentication script, because nobody really wants to manual generate the signature and build the http header cookie by hand.
#!/bin/bash
#
# Invoke: sh apic_query.sh <APIC-FQDN or IP> <API-Operation> <username> <password>
# Example: sh apic_query.sh sandboxapicdc.cisco.com /api/class/fabricHealthTotal.json telegraf telegraf
#
Pipe bash arguments to variables
apic=$1
operation=$2
user=$3
pass=$4
Create random cookie filename to avoid race conditions by multiple, concurrent script executions
cookiefilename=apic_cookie_$RANDOM
APIC Login and store session cookie to /etc/telegraf
curl -s -k -d "<aaaUser name=$user pwd=$pass/>" -c /etc/telegraf/$cookiefilename -X POST https://$apic/api/mo/aaaLogin.xml > /dev/null
APIC Query Operation using the session cookie
curl -s -k -X GET https://$apic$operation -b /etc/telegraf/$cookiefilename
APIC Logout
curl -s -k -d "<aaaUser name=$user/>" -X POST https://$apic/api/mo/aaaLogout.json -b /etc/telegraf/$cookiefilename > /dev/null
Remove session cookie
rm /etc/telegraf/$cookiefilename
Telegraf configuration
.conf files live in the /etc/telegraf/telegraf.d directory and query all metrics to populate the Grafana dashboard of this demo
Grafana
The Dashboard is a first idea to visualize central Cisco ACI metrics and should help to get started developing own solutions.
Data source config
Collector config:
Upload an updated version of an exported dashboard.json file from Grafana
| Revision | Description | Created | |
|---|---|---|---|
| Download |