App Resource Utilization
Dashboard for metrics-server-exporter
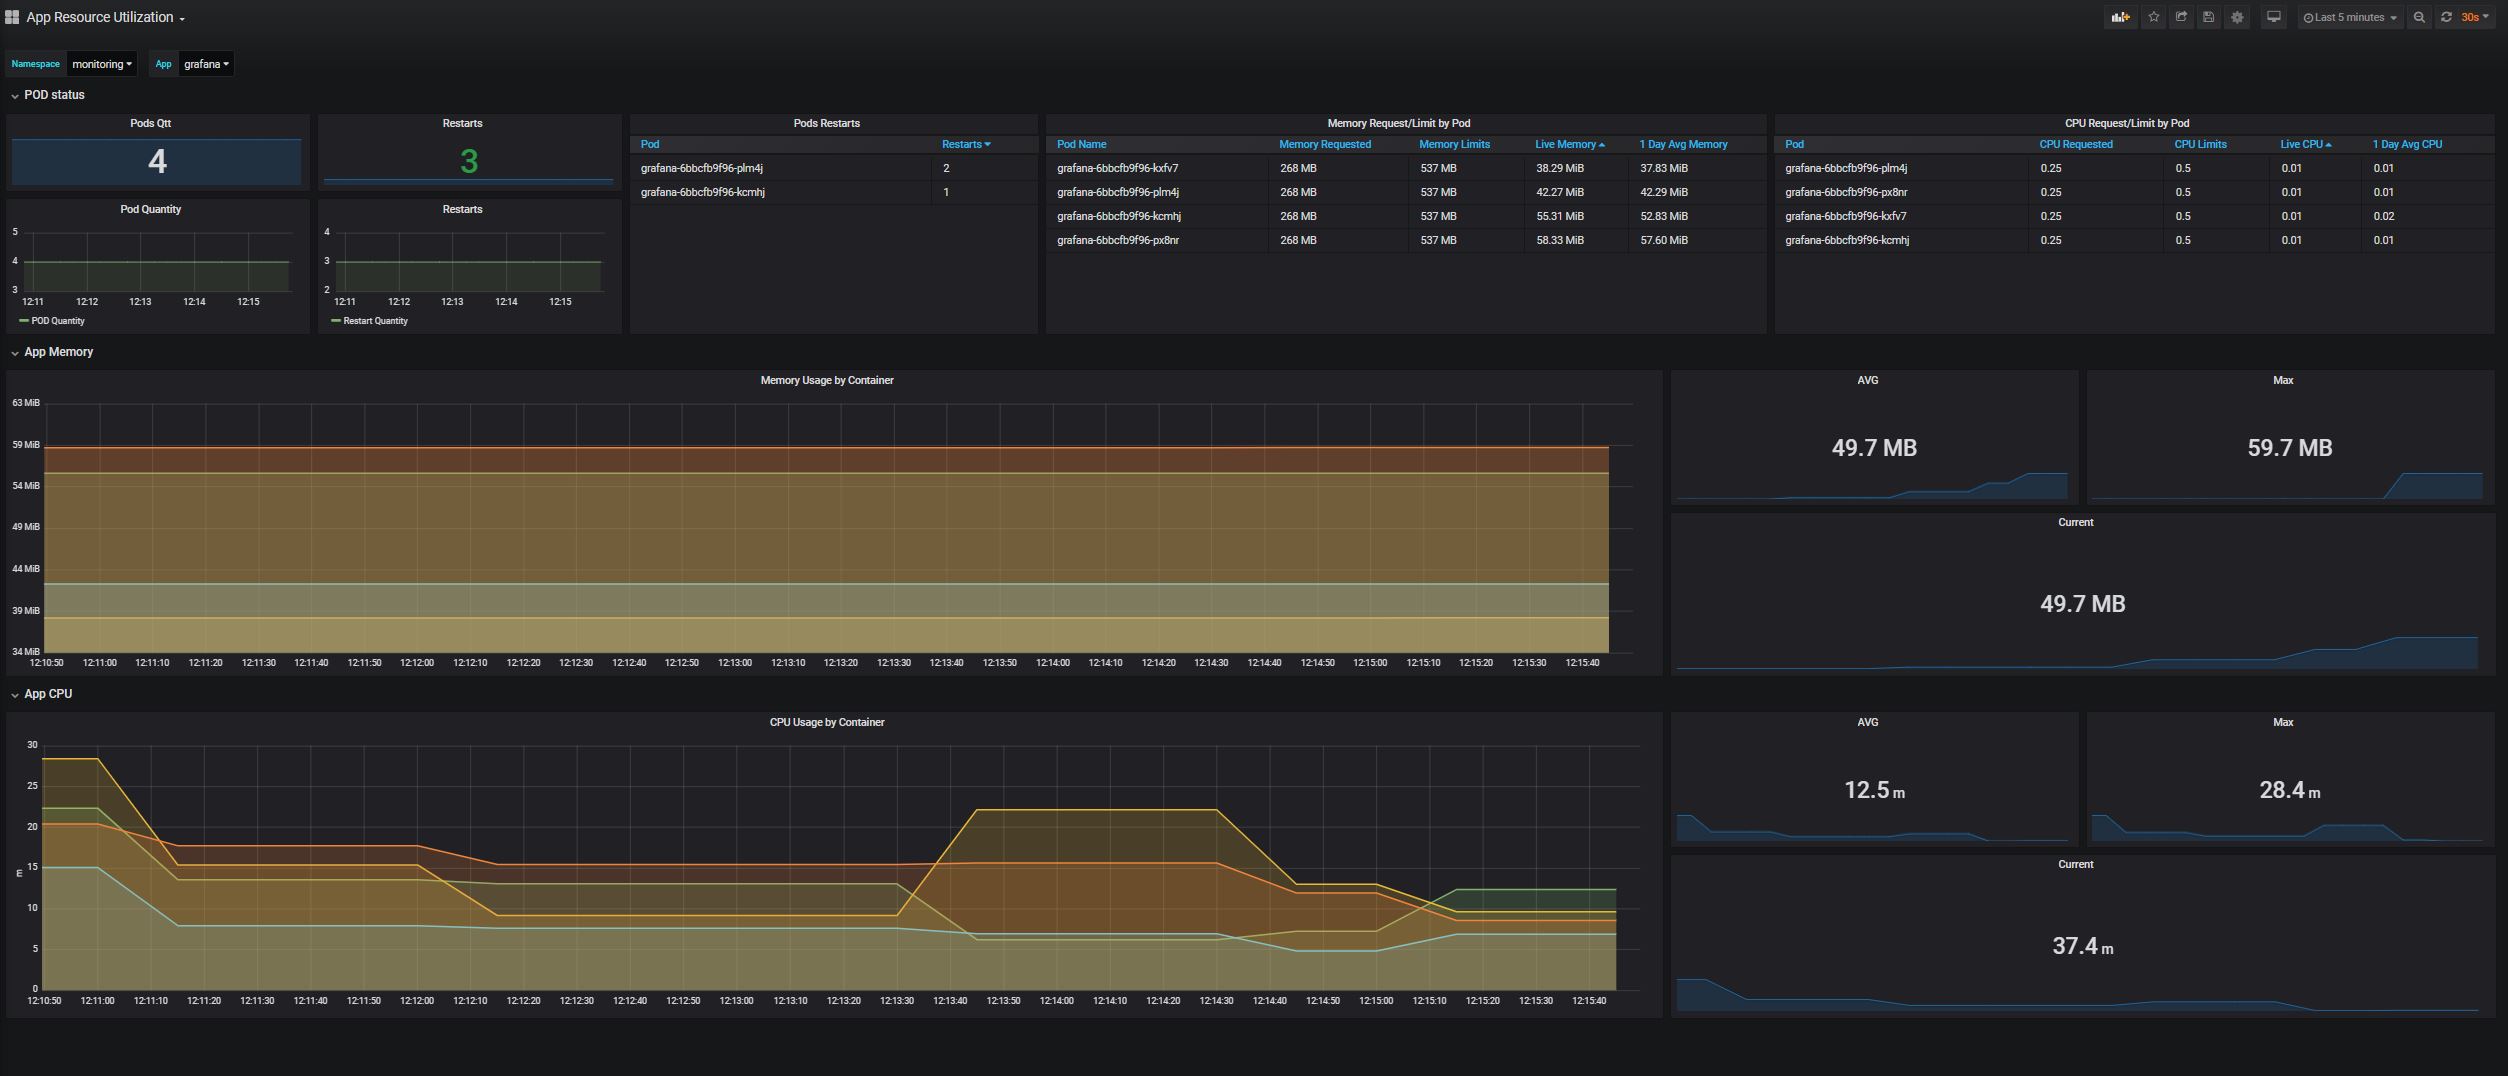
This dashboard will show you Memory and CPU usage from all apps and namespaces.
Must have:
- Kube state metrics (For pod count and restart counts)
- Metrics Server (For k8s CPU and Memory values)
- Metrics Server Exporter (Export metrics to a Prometheus format) https://github.com/grupozap/metrics-server-exporter
Our prometheus scrap format for kube-state-metrics and metrics-server-exporter
    - job_name: 'kubernetes-service-endpoints'
      kubernetes_sd_configs:
      - role: endpoints
      relabel_configs:
      - source_labels: [__meta_kubernetes_service_annotation_prometheus_io_scrape]
        action: keep
        regex: true
      - source_labels: [__meta_kubernetes_service_annotation_prometheus_io_scheme]
        action: replace
        target_label: __scheme__
        regex: (https?)
      - source_labels: [__meta_kubernetes_service_annotation_prometheus_io_path]
        action: replace
        target_label: __metrics_path__
        regex: (.+)
      - source_labels: [__address__, __meta_kubernetes_service_annotation_prometheus_io_port]
        action: replace
        target_label: __address__
        regex: ([^:]+)(?::\d+)?;(\d+)
        replacement: $1:$2
      - action: labelmap
        regex: __meta_kubernetes_service_label_(.+)
      - source_labels: [__meta_kubernetes_namespace]
        action: replace
        target_label: kubernetes_namespace
      - source_labels: [__meta_kubernetes_service_name]
        action: replace
        target_label: kubernetes_name
      - source_labels: [__meta_kubernetes_pod_name]
        action: replace
        target_label: kubernetes_pod_name
      - source_labels: [__meta_kubernetes_pod_name]
        action: replace
        target_label: pod
You can also monitor this with your own scrap rules and change the labels applied on variables and metrics
Data source config
Collector type:
Collector plugins:
Collector config:
Revisions
Upload an updated version of an exported dashboard.json file from Grafana
| Revision | Description | Created | |
|---|---|---|---|
| Download |