
IIS from WMI-Exporter
Monitor your IIS server with metrics coming from wmi_exporter.
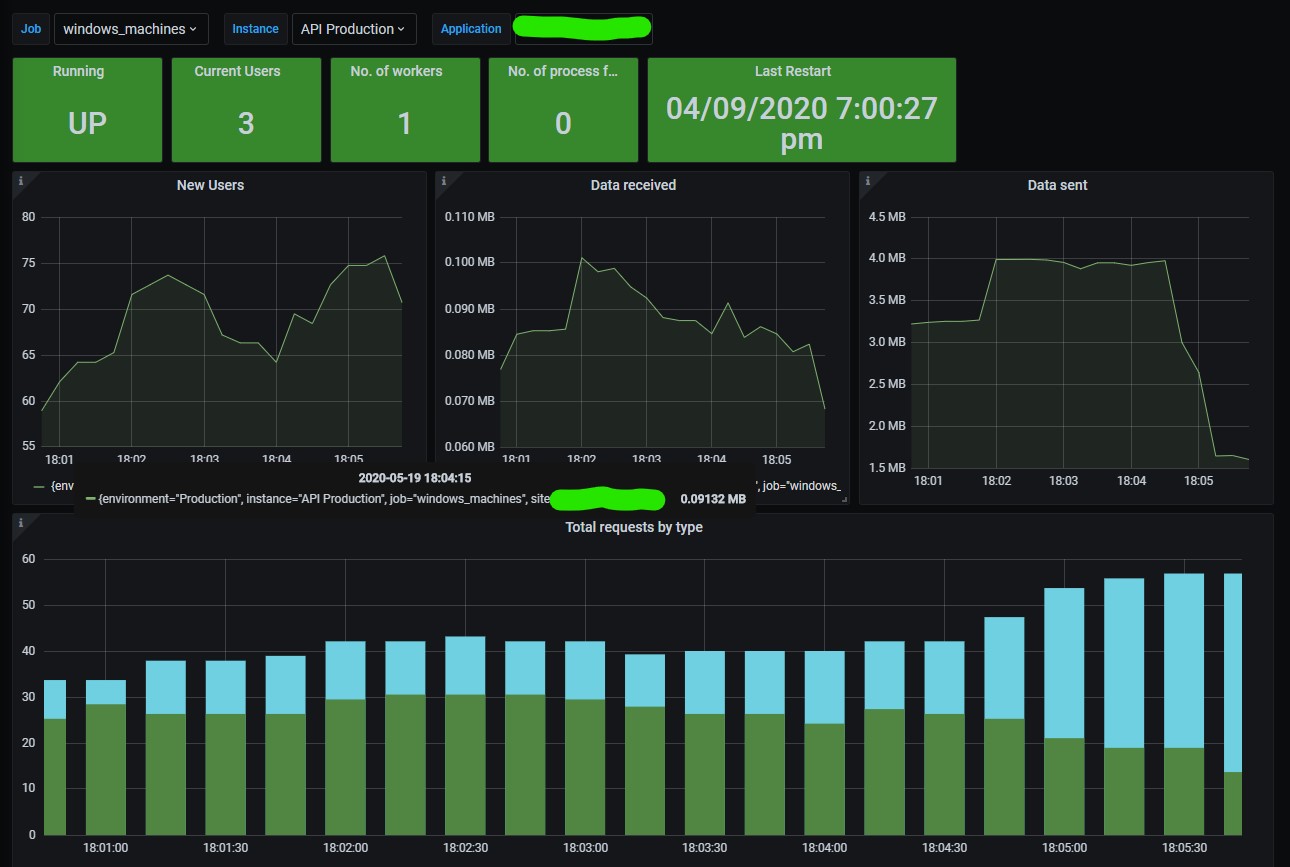
This is a dashboard that will show you some IIS metrics derived from wmi_exporter. Tested and works with version 0.11.1 of wmi_exporter. When installing it you must specify that you want IIS metrics included, they aren't by default.
msiexec -i ENABLED_COLLECTORS=cpu,cs,iis,logical_disk,net,os,service,system,textfile LISTEN_ADDR=0.0.0.0 LISTEN_PORT=9182 METRICS_PATH=/metrics
This scripts installs the wmi exporter with all of the default metrics + IIS metrics.
Data source config
Collector config:
Upload an updated version of an exported dashboard.json file from Grafana
| Revision | Description | Created | |
|---|---|---|---|
| Download |
Microsoft IIS
Easily monitor Microsoft IIS, a web server that can host and manage web apps on Windows servers, with Grafana Cloud's out-of-the-box monitoring solution.
Learn more