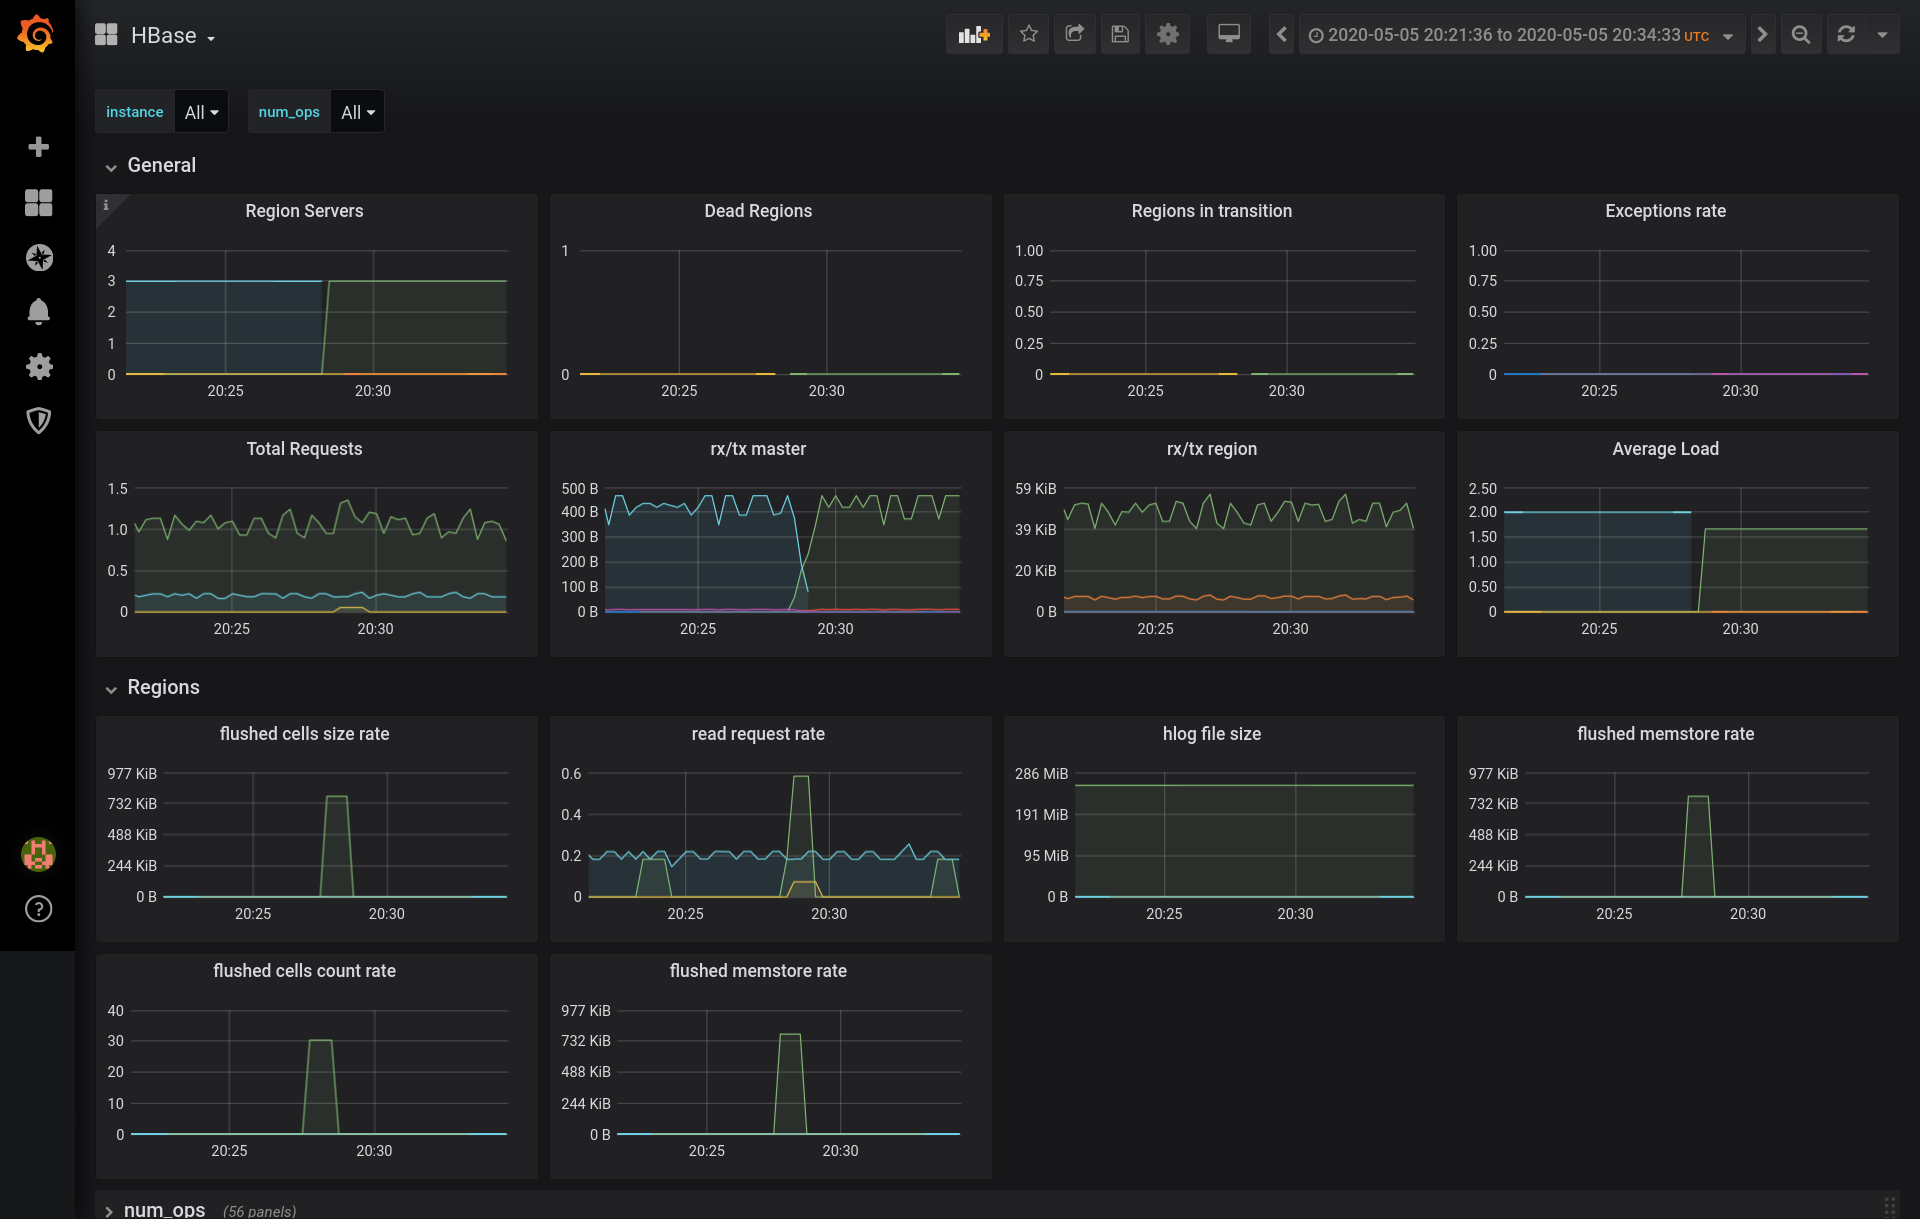
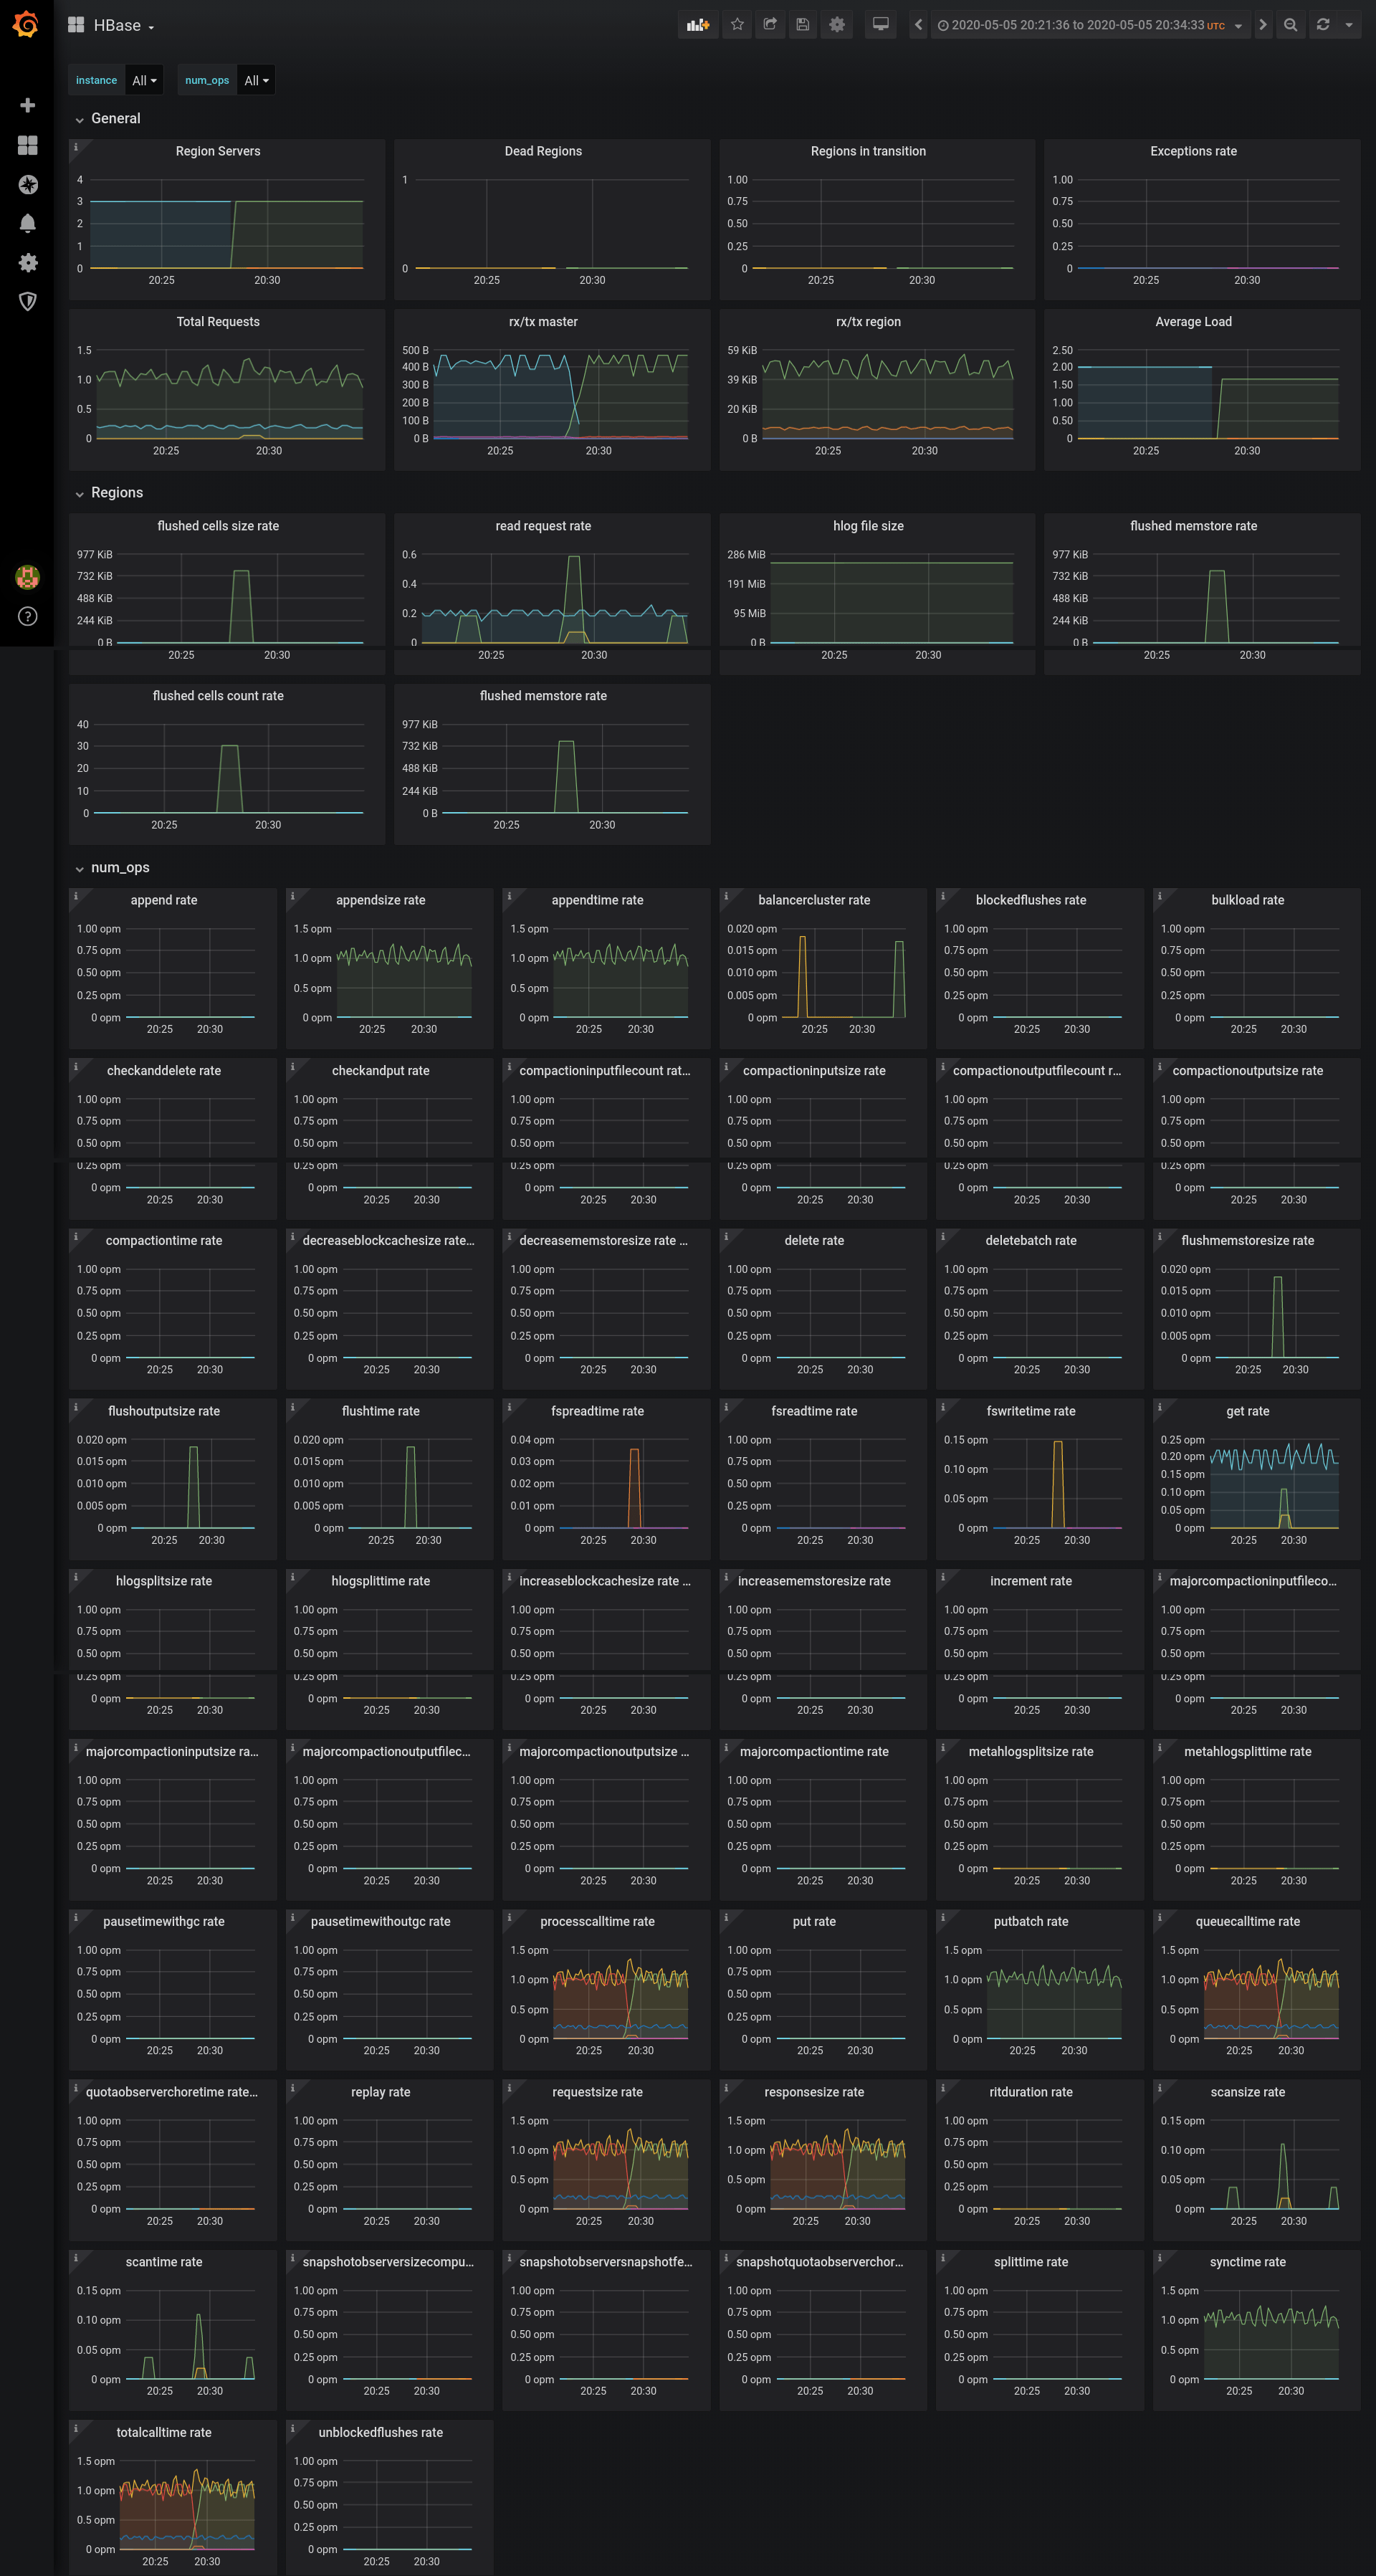
HBase 2.x
Hbase 2.x in kubernetes using prometheus jmx eporter
About
Initial test example. Not everything is rendered or usable.
Tested with
HBase on k8s:
- k8s 1.15.x
- prometheus v2.17.2 via prometheus-operator
- grafana v6.7.3 (a04ef6cefc) with prometheus as Data Source
- Hadoop 3.1.3 (ninja deployment on kubernetes ;))
- hbase 2.2.4 with
spdigital/prometheus-jmx-exporter-kubernetes:0.3.1(default) via gradiant/charts
Known limitations
- You need to create service monitor on your own.
- You may need to adjust dashboard to match your prometheus labels
- Vast majority of metrics is not yet exposed on the graphs, but you can add them on your own
- Some metrics are duplicated because the way they are exposed by jmx_exporter
Changelog
- Fixed selector used for 'instances' - it was previously getting all instances existing for any metric, and now it only takes the instances which are specific for region or master server only. This dramatically speeds up graph loading
- Initial release
Contact
- contact author if you have any suggestions etc
Data source config
Collector config:
Upload an updated version of an exported dashboard.json file from Grafana
| Revision | Description | Created | |
|---|---|---|---|
| Download |
Apache HBase
Easily monitor Apache HBase, an open source non-relational distributed database, with Grafana Cloud's out-of-the-box monitoring solution.
Learn more

