Hadoop HDFS FSImage
Used with Prometheus Hadoop HDFS FSImage Exporter in kubernetes
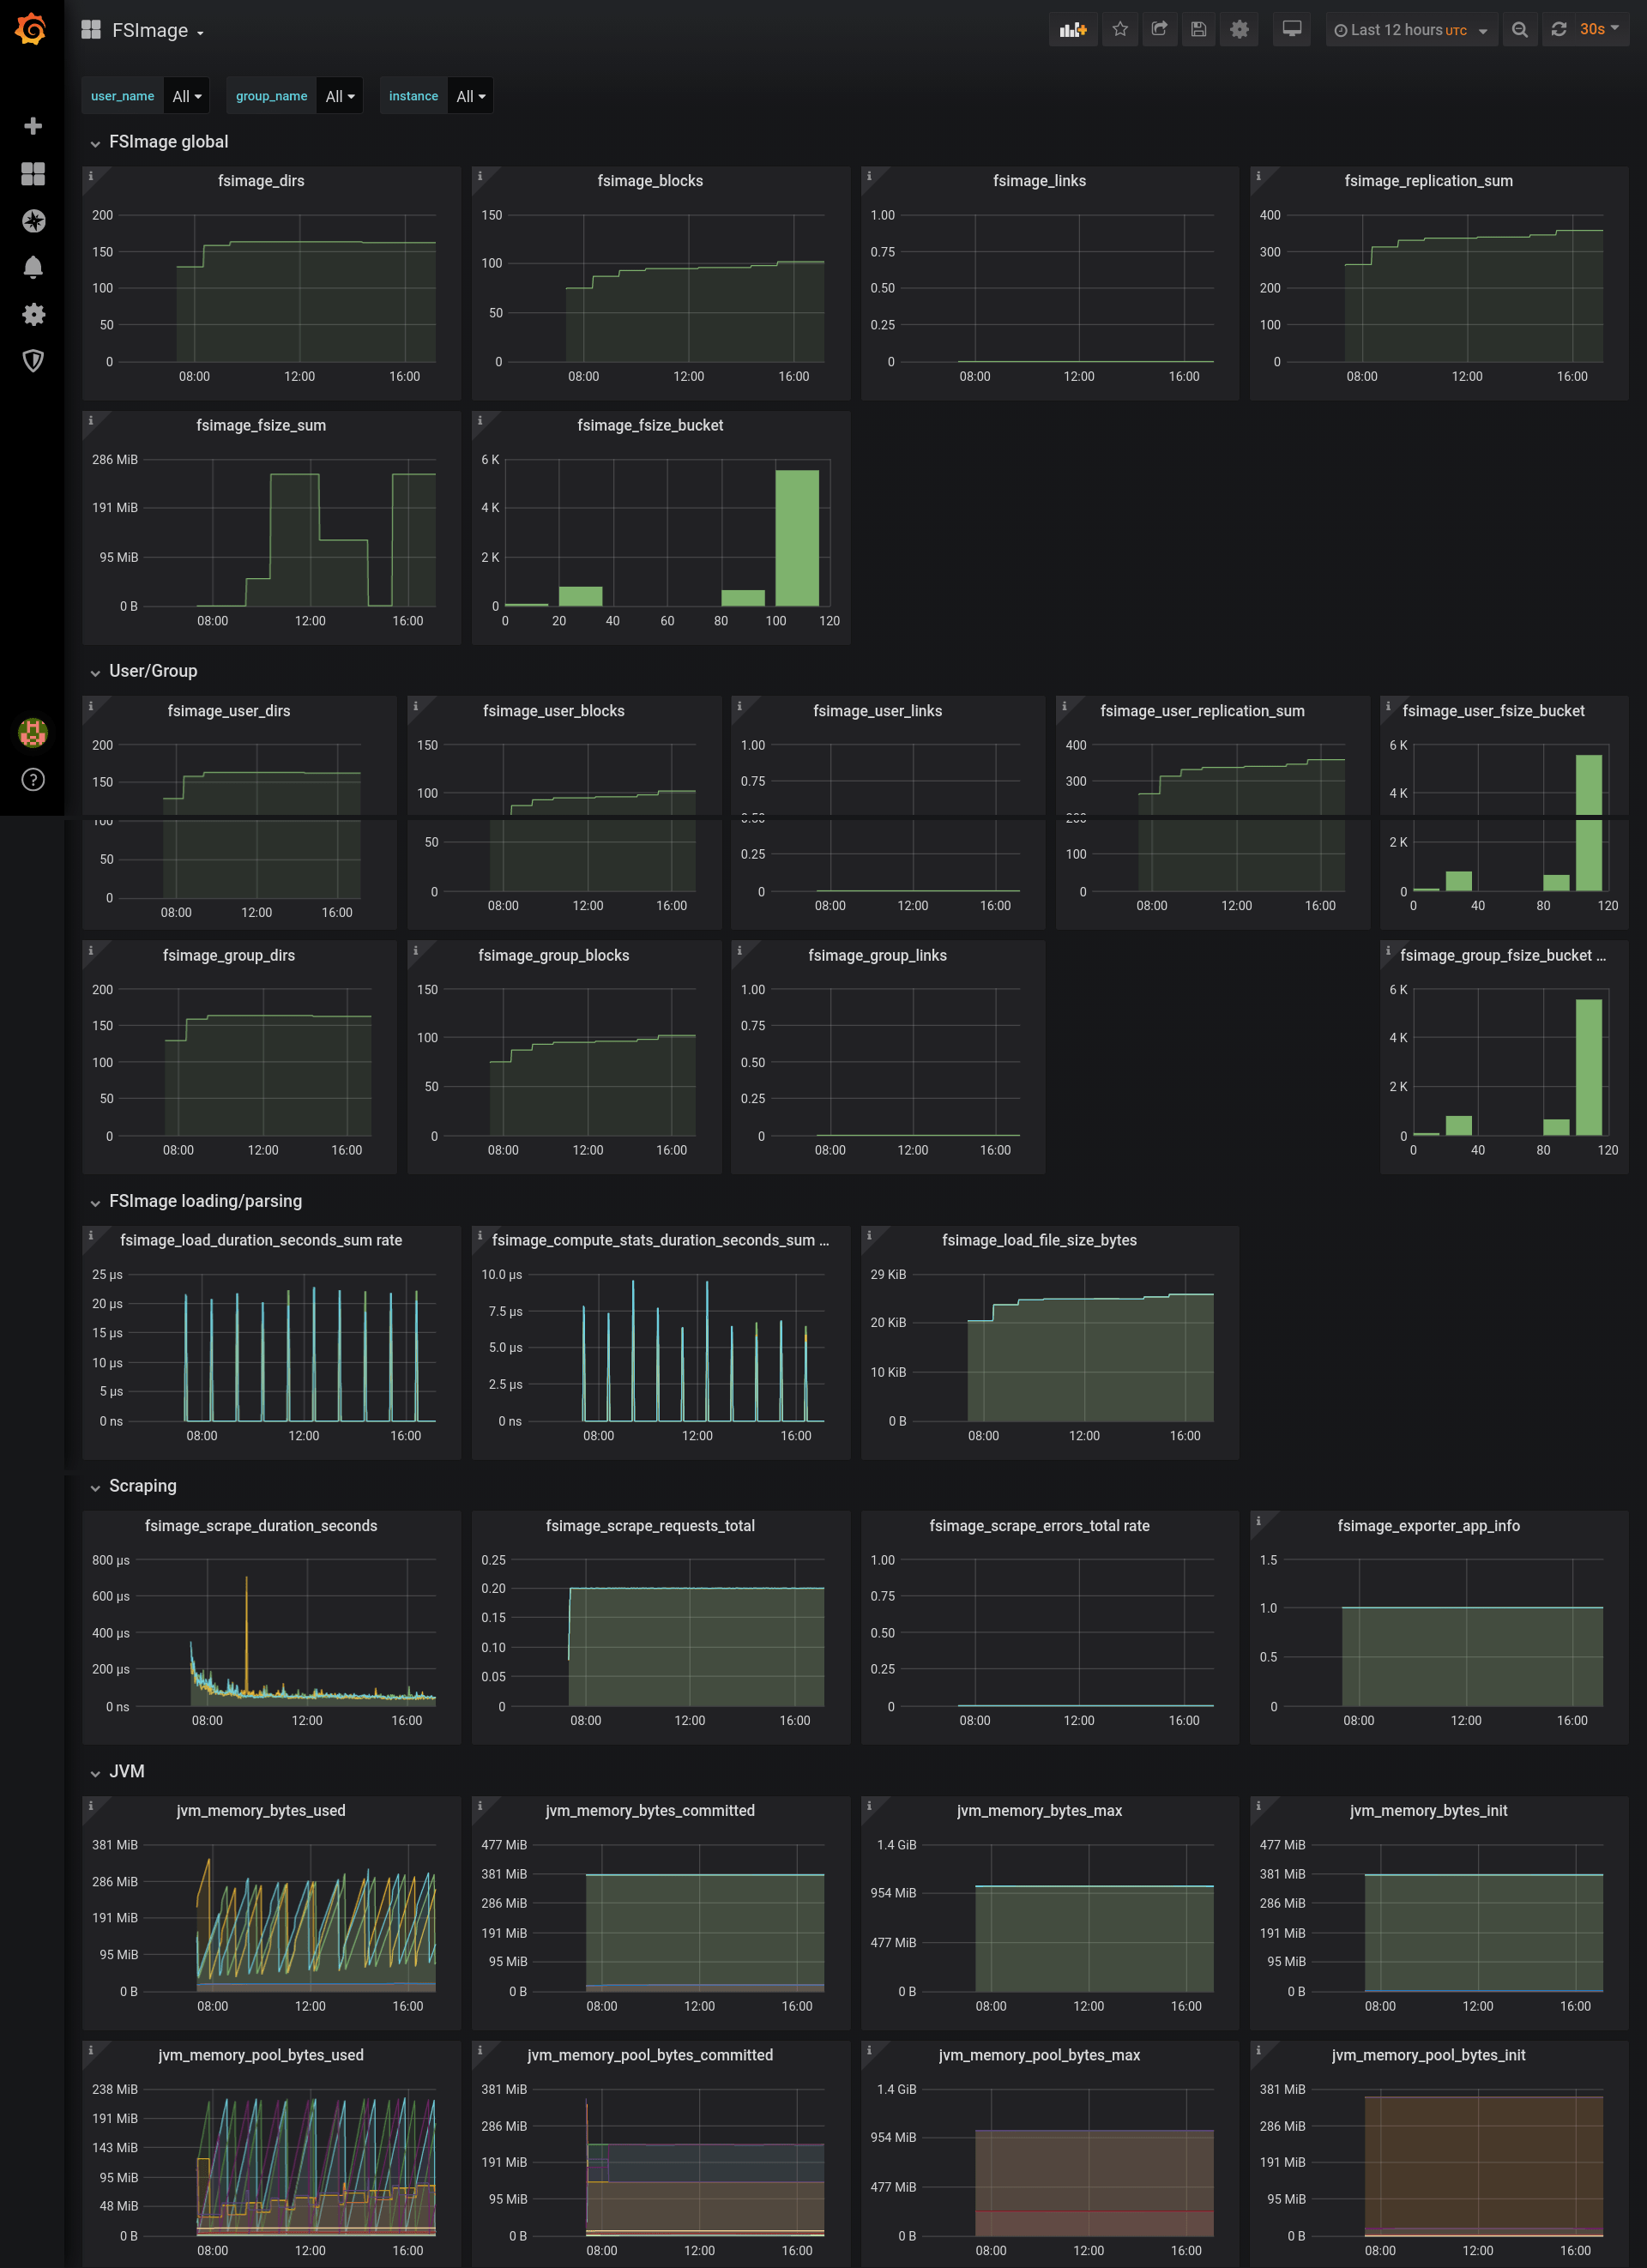
About
Initial dashboard for hadoop in kubernetes (wait what?)
This is mainly a test of hdfs + nn + zk + jn in k8s:
- k8s 1.15.x
- prometheus v2.17.2 via prometheus-operator
- grafana v6.7.3 (a04ef6cefc) with prometheus as Data Source
- Hadoop 3.1.3 in HA setup ( zookeeper cluster + 3 journalnodes + 3 namenodes, which means 1 active nn and 2 standby)
- marcelmay/hadoop-hdfs-fsimage-exporter v1.3 as sidecar in namenode pods, version 1.3 required for hadoop 3.x
- ServiceMonitor to scrape metrics - you must add ti on your own.
Known limitations
- You need to create service monitor on your own.
- You may need to adjust dashboard to match your prometheus labels
- Vast majority of metrics is not yet exposed on the graphs, but you can add them on your own
Changelog
- added variable for DS_PROMETHEUS so that json file can be directly added to grafana data directory and solves errors such as
Templating init failed Datasource named ${DS_PROMETHEUS} was not found`
- initial release
Contact
- contact author if you have any suggestions etc
Data source config
Collector type:
Collector plugins:
Collector config:
Revisions
Upload an updated version of an exported dashboard.json file from Grafana
| Revision | Description | Created | |
|---|---|---|---|
| Download |
Apache Hadoop
Easily monitor your deployment of Apache Hadoop, the open source framework designed to process and store large amounts of data across distributed clusters of computers, with Grafana Cloud's out-of-the-box monitoring solution.
Learn more