Node.js Dashboard
Monitor metrics for node.js and express router status.
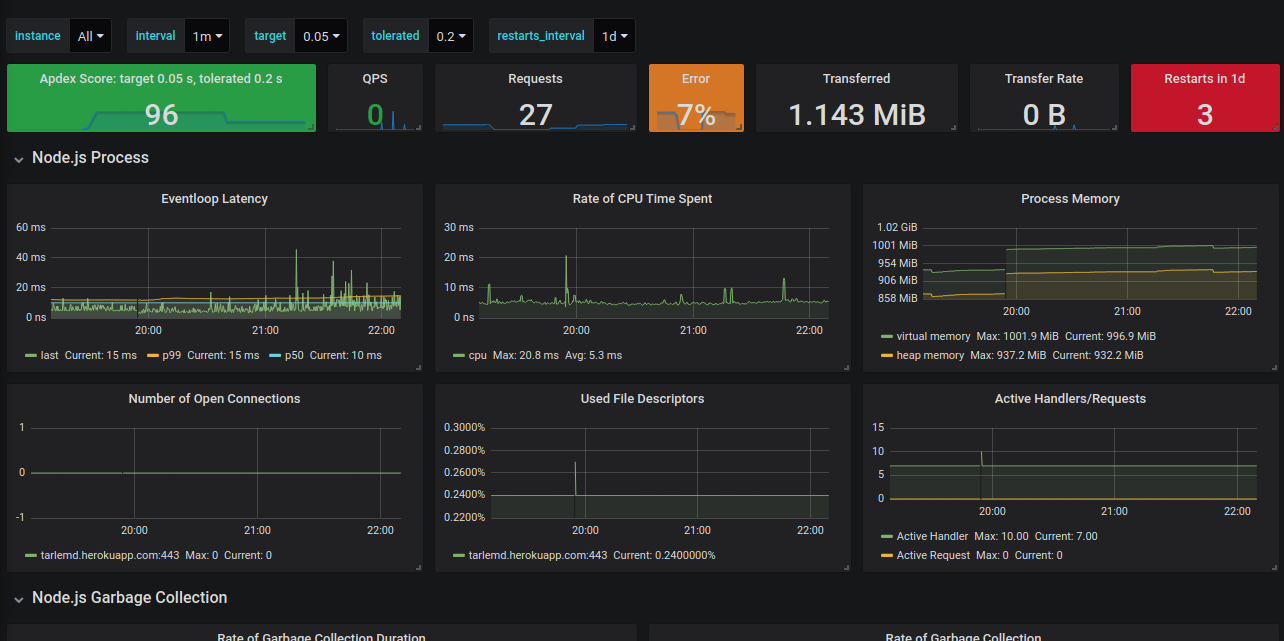
A Grafana dashboard for prometheus-api-metrics.
Usage:
const apiMetrics = require('prometheus-api-metrics');
app.use(apiMetrics());
Data source config
Collector type:
Collector plugins:
Collector config:
Revisions
Upload an updated version of an exported dashboard.json file from Grafana
| Revision | Description | Created | |
|---|---|---|---|
| Download |