
Grafana Dashboard to monitor Owl USB CM160 Electricity Consumption
Just download the latest PowerShell script version from GitHub https://raw.githubusercontent.com/jorgedlcruz/owlCM160-grafana/master/owlCM160_Influx.ps1 and change the Configuration section within your details:
# System variables, on here you need to replace the next ones with your own paths, IPs, pass, etc.
#By default the SystemDataSQLLitePath on mi case was C:\Program Files\System.Data.SQLite\2015\bin\System.Data.SQLite.dll
$SystemDataSQLLitePath="YOURPATHTOTHESQLLITEASSEMBLY"
$NumberArray="THEMINUTESYOUWANTTORETRIEVE"
$InfluxDBURL="https://YOURINFLUXDBSERVER"
$InfluxDBPort="8086"
$InfluxDBDB="YOURINFLUXDB"
$InfluxDBUser='YOURINFLUXUSER'
$InfluxDBPass='YOURINFLUXPASS' | ConvertTo-SecureString -asPlainText -Force
Once the changes are done, please schedule the script on your Windows Task Scheduler.
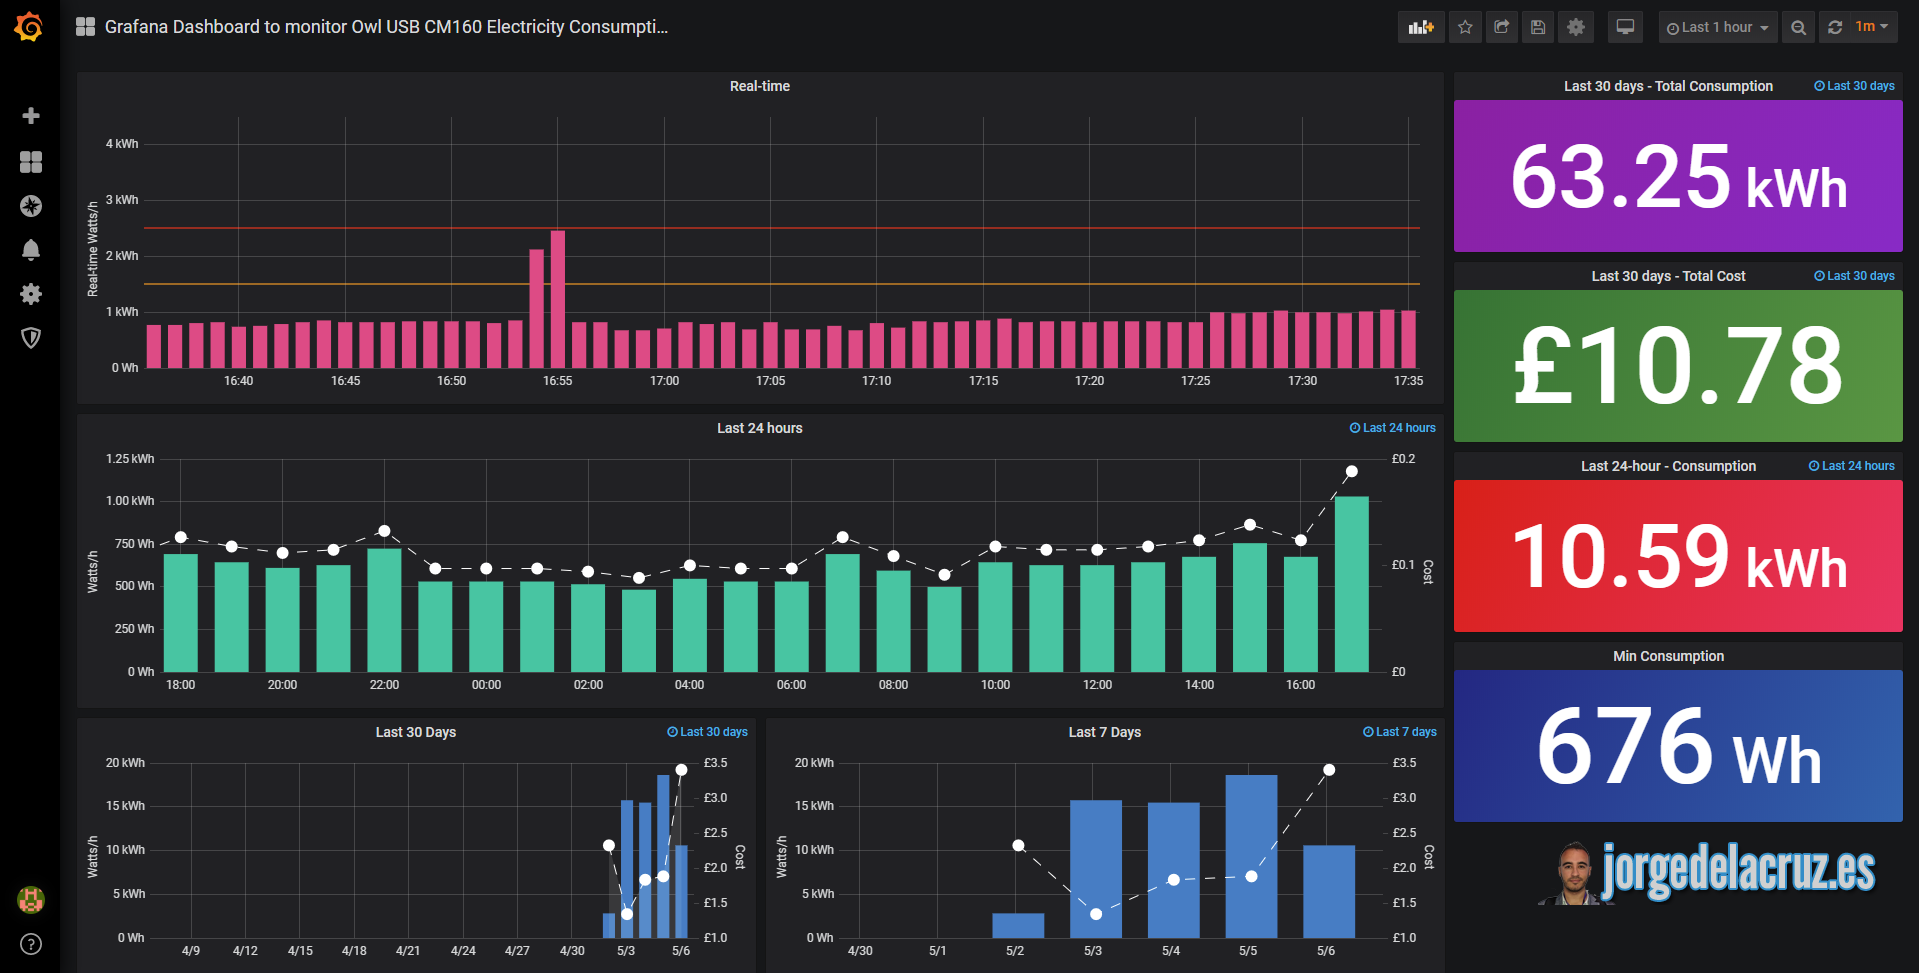
Then download or import this Dashboard to your Grafana, and you should see something similar to the next:

Data source config
Collector type:
Collector plugins:
Collector config:
Dashboard revisions
Upload an updated version of an exported dashboard.json file from Grafana
| Revision | Decscription | Created | |
|---|---|---|---|
| Download |
Sign up for Grafana Cloud

Get up and running in minutes with the Grafana Cloud free tier, which includes free forever 10k metrics, 50GB logs, 50GB traces, 500 VUh, and more.
Get this dashboard
Data source:
Dependencies: