SNMP Exporter Internal Stats
Internal metrics of Prometheus' snmp_exporter
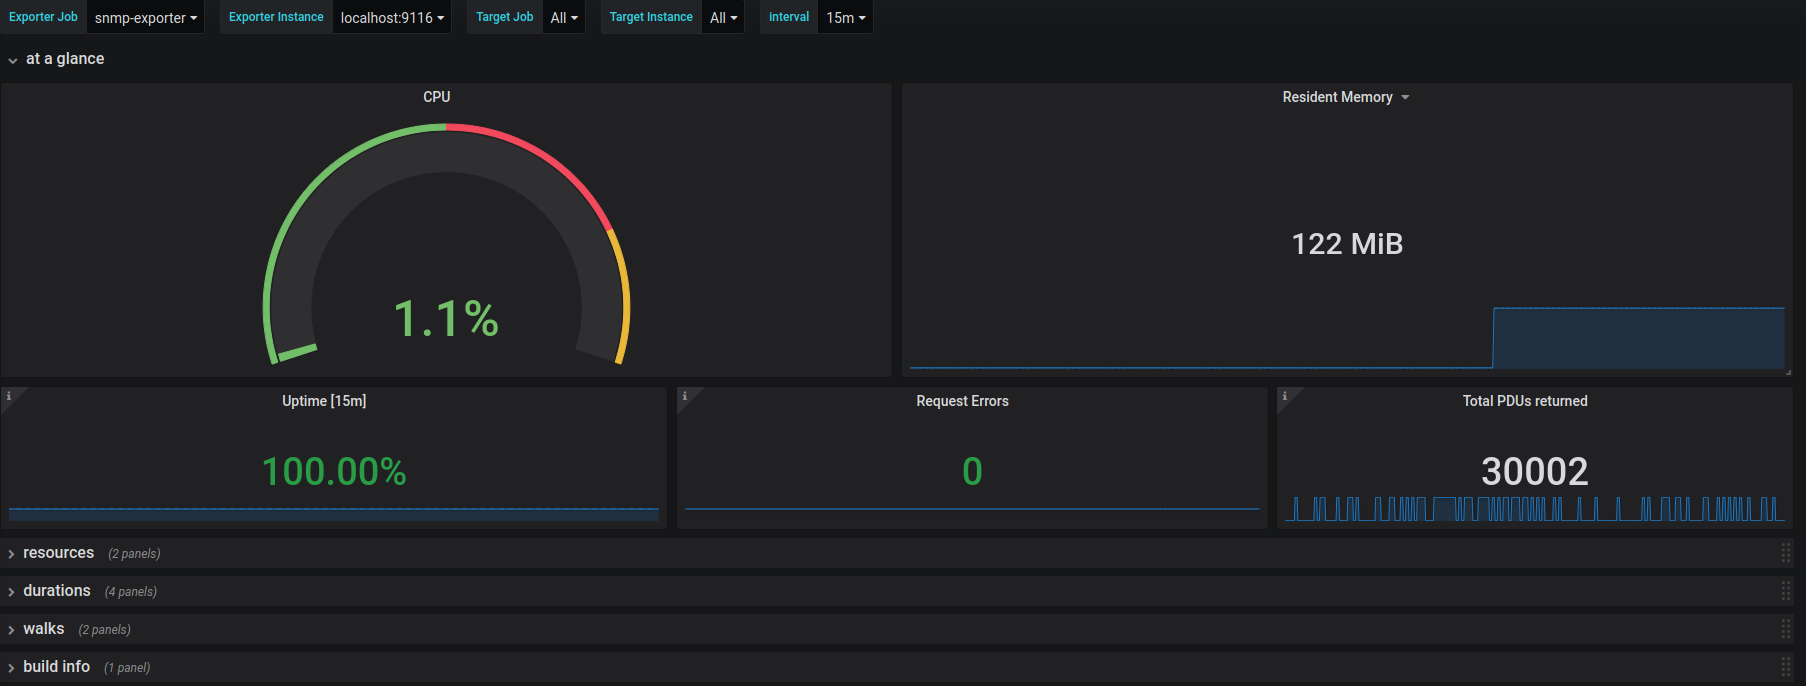
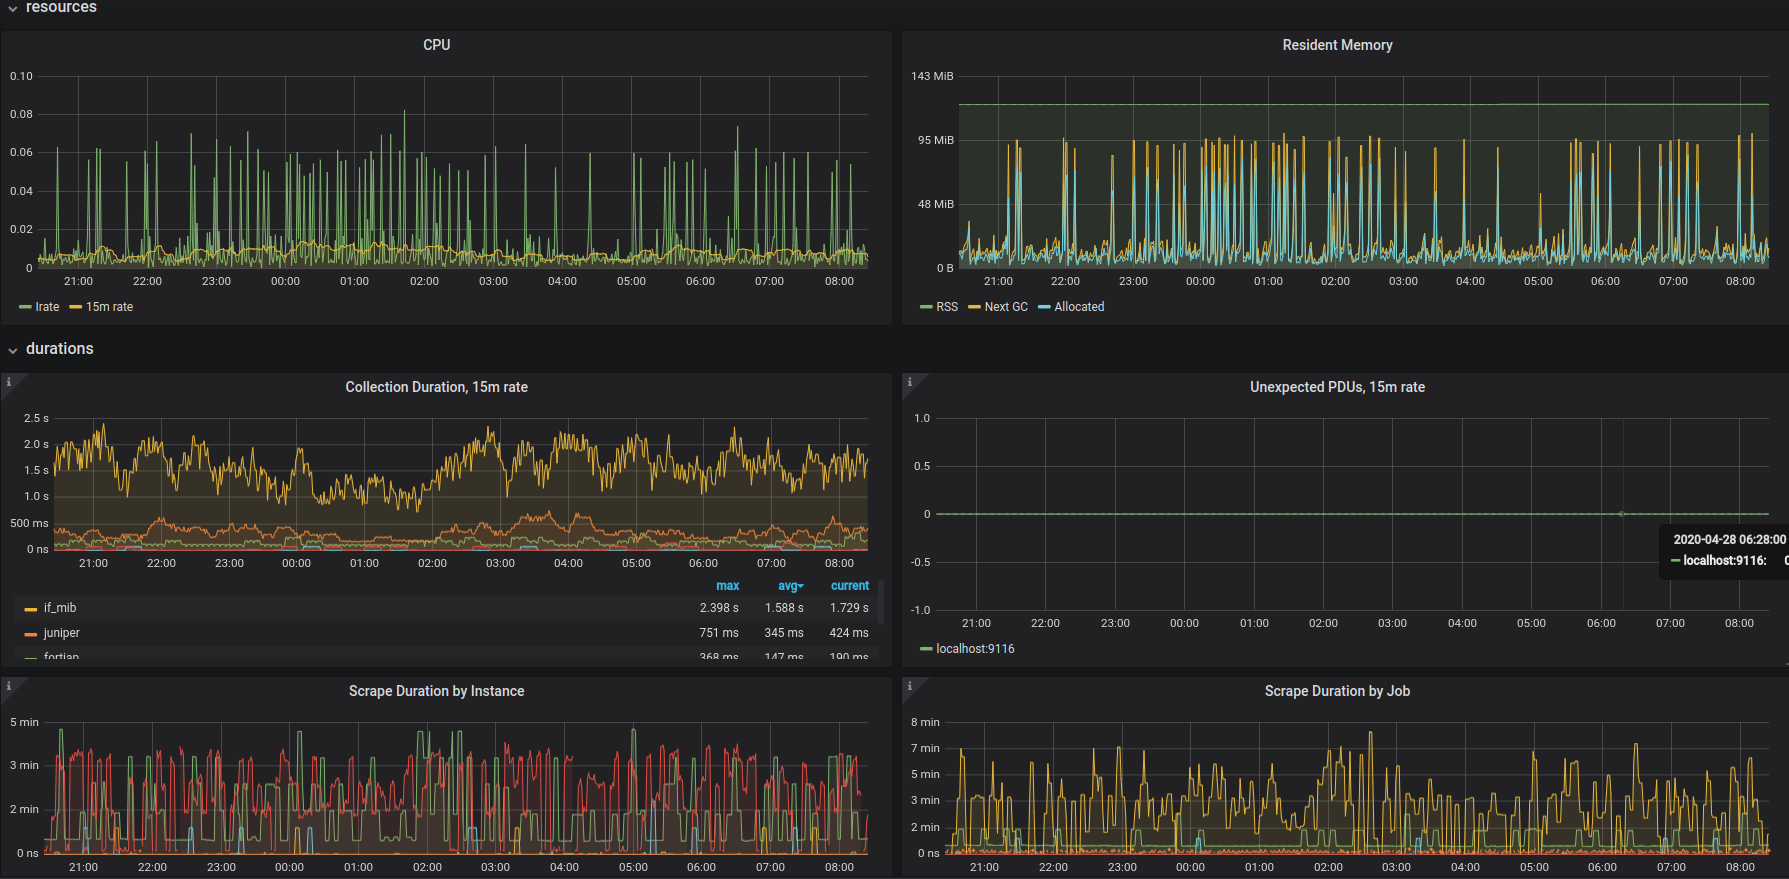
Shows internal metrics about Prometheus' snmp_exporter:
- Resources
- Errors
- Collection Durations
- Walk durations
Data source config
Collector type:
Collector plugins:
Collector config:
Revisions
Upload an updated version of an exported dashboard.json file from Grafana
| Revision | Description | Created | |
|---|---|---|---|
| Download |
SNMP
Easily monitor any generic SNMP (Simple Network Management Protocol) device with Grafana Cloud's out-of-the-box monitoring solution.
Learn more