
Grafana Dashboard for Wordpress.com Jetpack Analytics
Grafana Dashboard for Wordpress.com Jetpack Analytics
Just download the latest Wordpress.com Jetpack script version from GitHub https://github.com/jorgedlcruz/wordpress-grafana/raw/master/wordpress_grafana.sh and change the Configuration section within your details:
##
# Configurations
##
# Endpoint URL for InfluxDB
InfluxDBURL="YOURINFLUXSERVERIP" #Your InfluxDB Server, http://FQDN or https://FQDN if using SSL
InfluxDBPort="8086" #Default Port
InfluxDB="telegraf" #Default Database
InfluxDBUser="USER" #User for Database
InfluxDBPassword="PASSWORD" #Password for Database

# Endpoint URL for login action
WPSiteURL="YOURSITE"
WPAuthBearer="YOURAUTHCODE"
Once the changes are done, make the script executable with chmod:
chmod +x wordpress_grafana.shThe output of the command should be something like the next, without errors:
HTTP/1.1 204 No Content
Content-Type: application/json
Request-Id: 9ba3716e-8868-11ea-ad9d-0050569002da
X-Influxdb-Build: OSS
X-Influxdb-Version: 1.7.10
X-Request-Id: 9ba3716e-8868-11ea-ad9d-0050569002da
Date: Mon, 27 Apr 2020 09:22:25 GMT
If so, please now add this script to your crontab, like for example every 30 minutes:
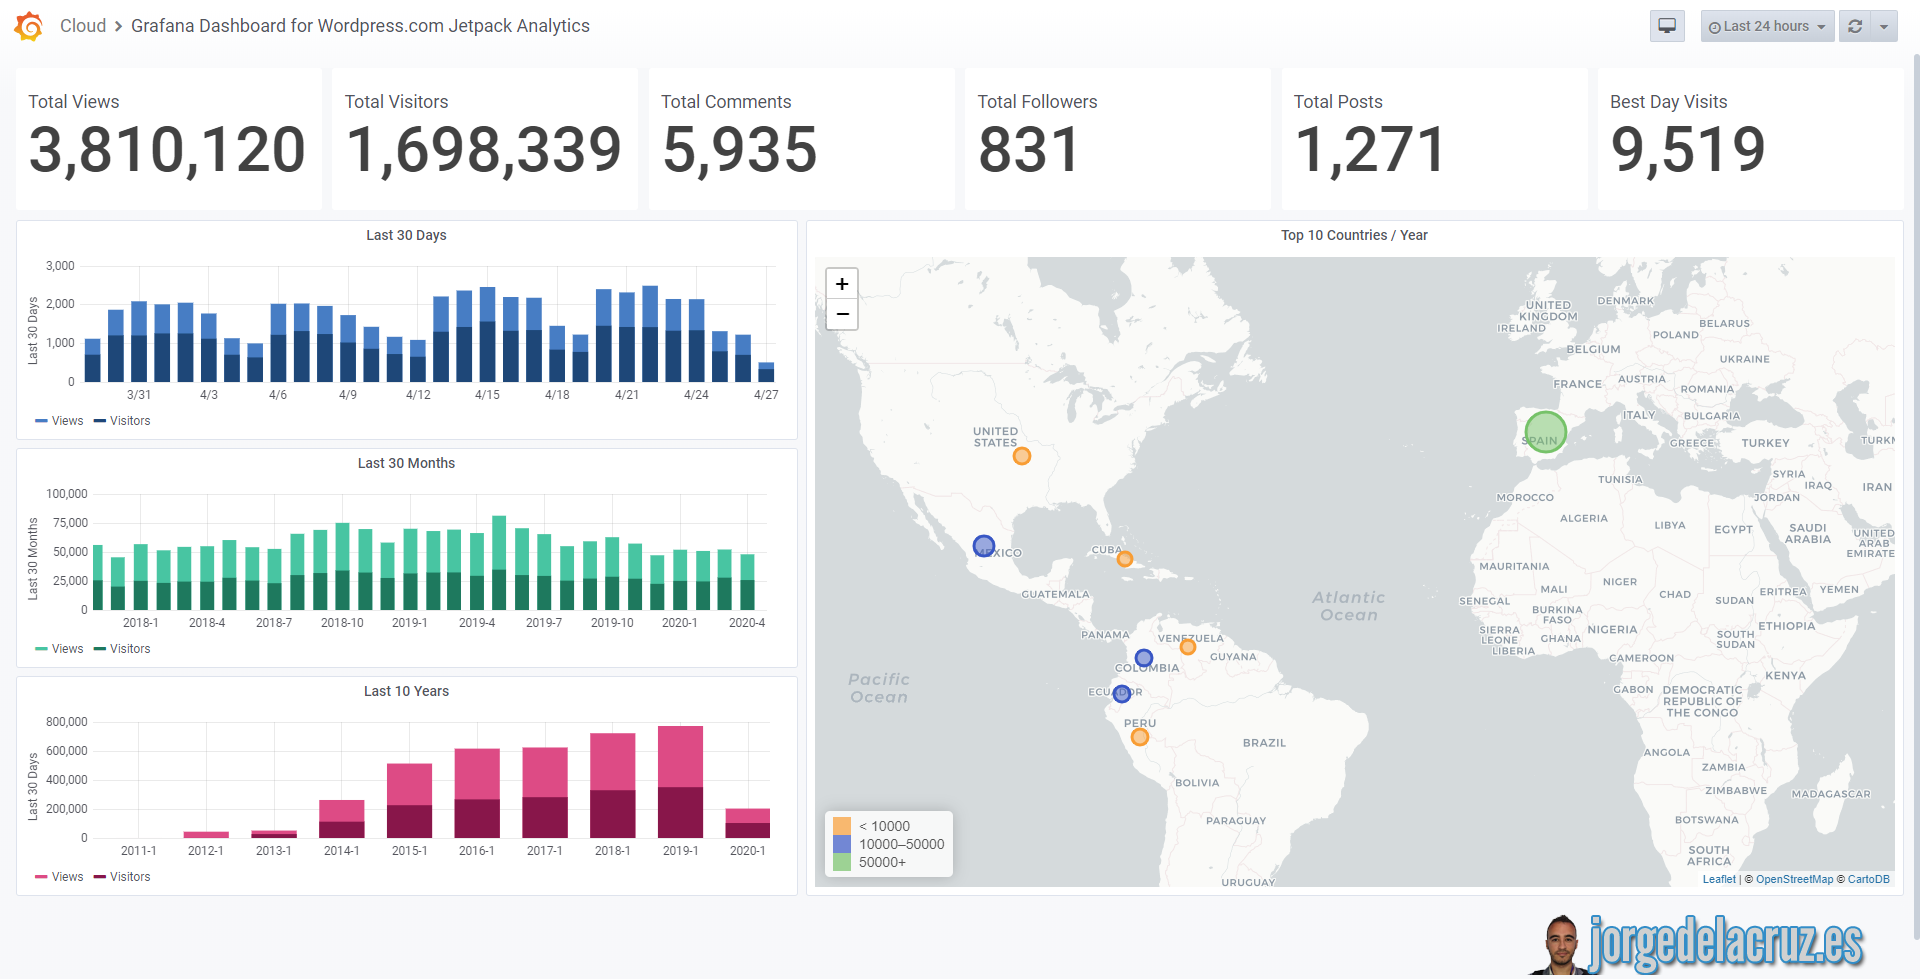
*/30 * * * * /home/oper/wordpress_grafana.sh >> /var/log/wordpress-stats.log 2>&1Then download or import this Dashboard to your Grafana, and you should see something similar to the next:

Data source config
Collector type:
Collector plugins:
Collector config:
Dashboard revisions
Upload an updated version of an exported dashboard.json file from Grafana
| Revision | Decscription | Created | |
|---|---|---|---|
| Download |
Sign up for Grafana Cloud

Get up and running in minutes with the Grafana Cloud free tier, which includes free forever 10k metrics, 50GB logs, 50GB traces, 500 VUh, and more.
Get this dashboard
Data source:
Dependencies: