
1 OpenEBS Dashboard
This dashboard gives overview of OpenEBS installation in cluster.
Special Plugin dependencies:
- Status dot
- single stat
Variables to be edited: OpenEBS namespace has been set to “openebs” which can be changed as per your env.
latest dashboard JSON: dguyhasnoname/k8s-day2-ops/grafana/dashboards/openebs_by_dguyhasnoname
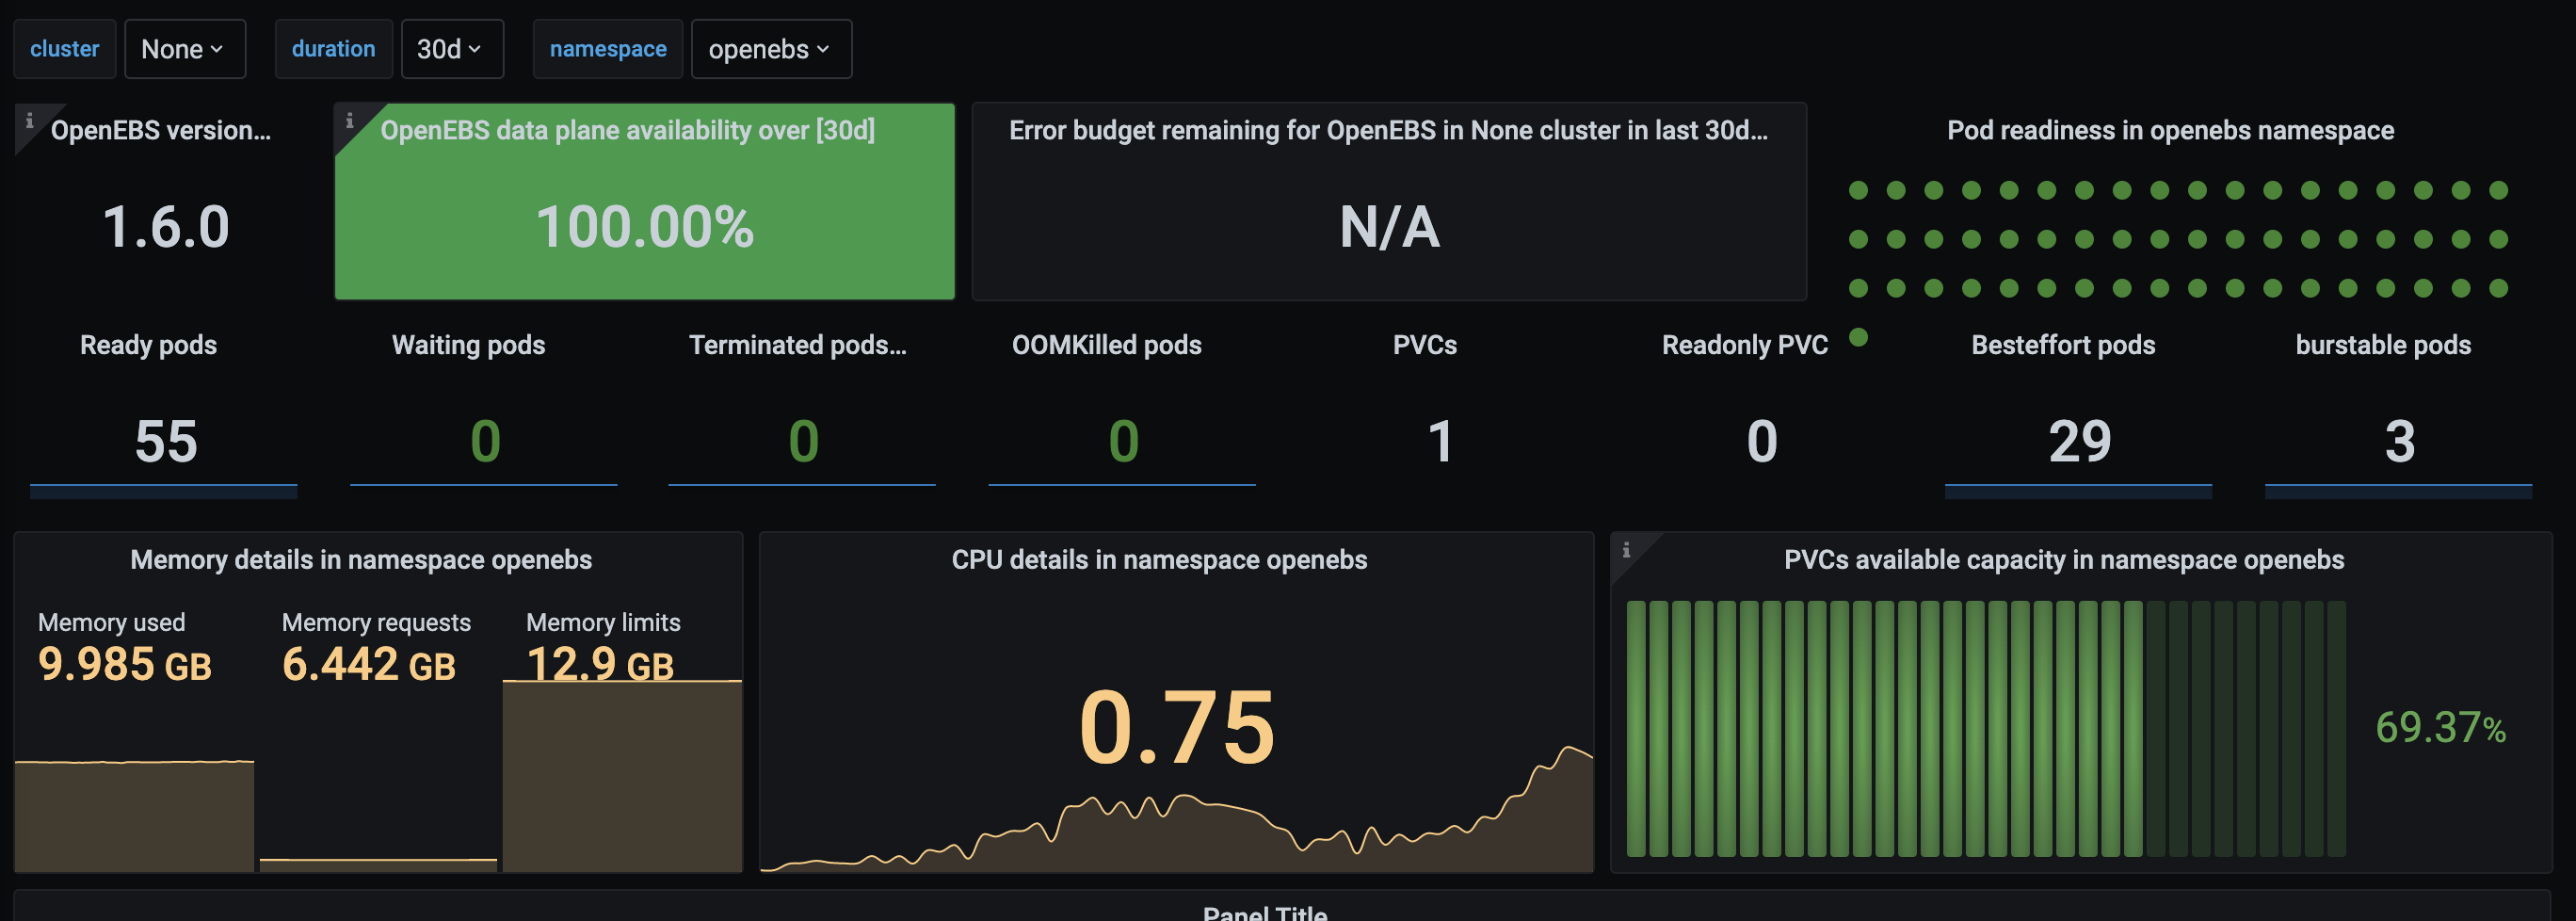
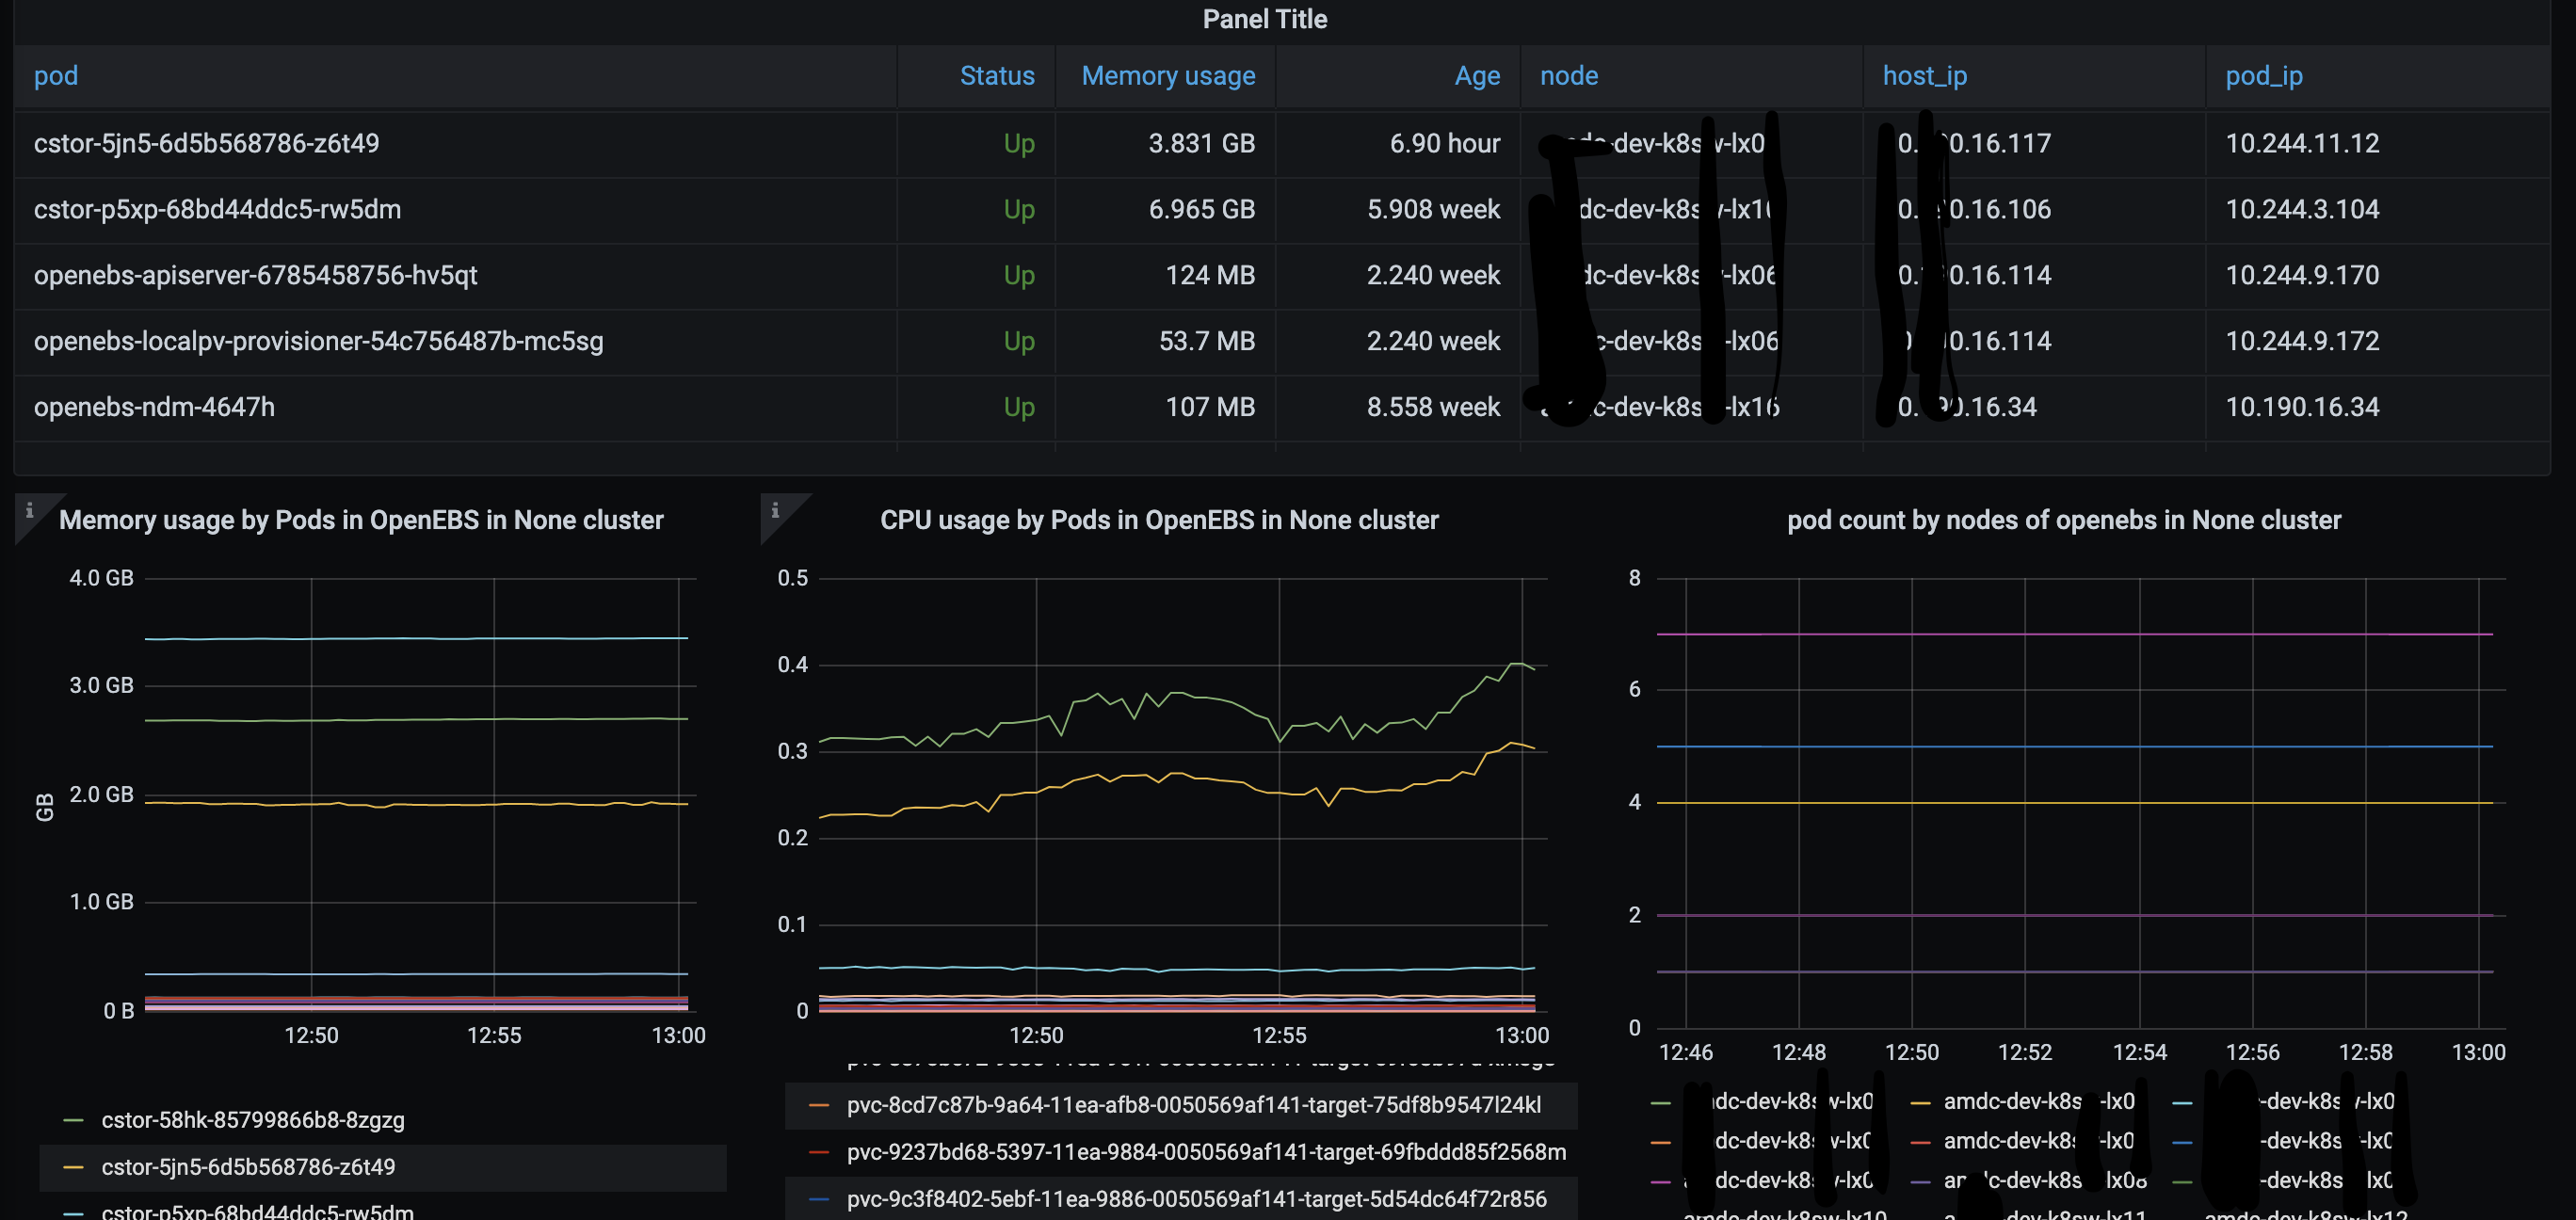
This dashboard give overview of OpenEBS installation in k8s cluster at cluster. At OpenEBS level you can find below details:
- OpenEBS version installed
- OpenEBS dataplane SLO
- OpenEBS error budget
- OpenEBS replica status
- CPU/mem utilisation by OpenEBS pods
- count of ready/waiting/terminated/OOMkilled pods
- Number of PVCs
- Count of ready-only PVCs
Error budget has been calculated on basis of 98.999999999999999% availability. SLO(availability) has been calculated for data plane pods only.
This dashboard is battle tested. Please feel free to leave comments if you have any inputs for improvement.
Data source config
Collector config:
Dashboard revisions
Upload an updated version of an exported dashboard.json file from Grafana
| Revision | Decscription | Created | |
|---|---|---|---|
| Download |
Get this dashboard
Data source:
Dependencies: