
Grafana Dashboard for Cloudflare Analytics and Overview
Grafana Dashboard for Cloudflare - Pulls out all the Cloudflare Information, and Analytics from the GraphQL API.
Just download the latest Cloudflare script version from GitHub https://raw.githubusercontent.com/jorgedlcruz/cloudflare-grafana/master/cloudflare-analytics.sh and change the Configuration section within your details:
##
# Configurations
##
# Endpoint URL for InfluxDB
InfluxDBURL="YOURINFLUXSERVERIP" #Your InfluxDB Server, http://FQDN or https://FQDN if using SSL
InfluxDBPort="8086" #Default Port
InfluxDB="telegraf" #Default Database
InfluxDBUser="USER" #User for Database
InfluxDBPassword="PASSWORD" #Password for Database

# Endpoint URL for login action
cloudflareapikey="YOURAPIKEY"
cloudflarezone="YOURZONEID"
cloudflareemail="YOUREMAIL"
Once the changes are done, make the script executable with chmod:
chmod +x cloudflare-analytics.shThe output of the command should be something like the next, without errors:
HTTP/1.1 204 No Content
Content-Type: application/json
Request-Id: b084ba16-8622-11ea-8dbc-0050569002da
X-Influxdb-Build: OSS
X-Influxdb-Version: 1.7.10
X-Request-Id: b084ba16-8622-11ea-8dbc-0050569002da
Date: Fri, 24 Apr 2020 11:56:53 GMT
If so, please now add this script to your crontab, like for example everyday at 9am:
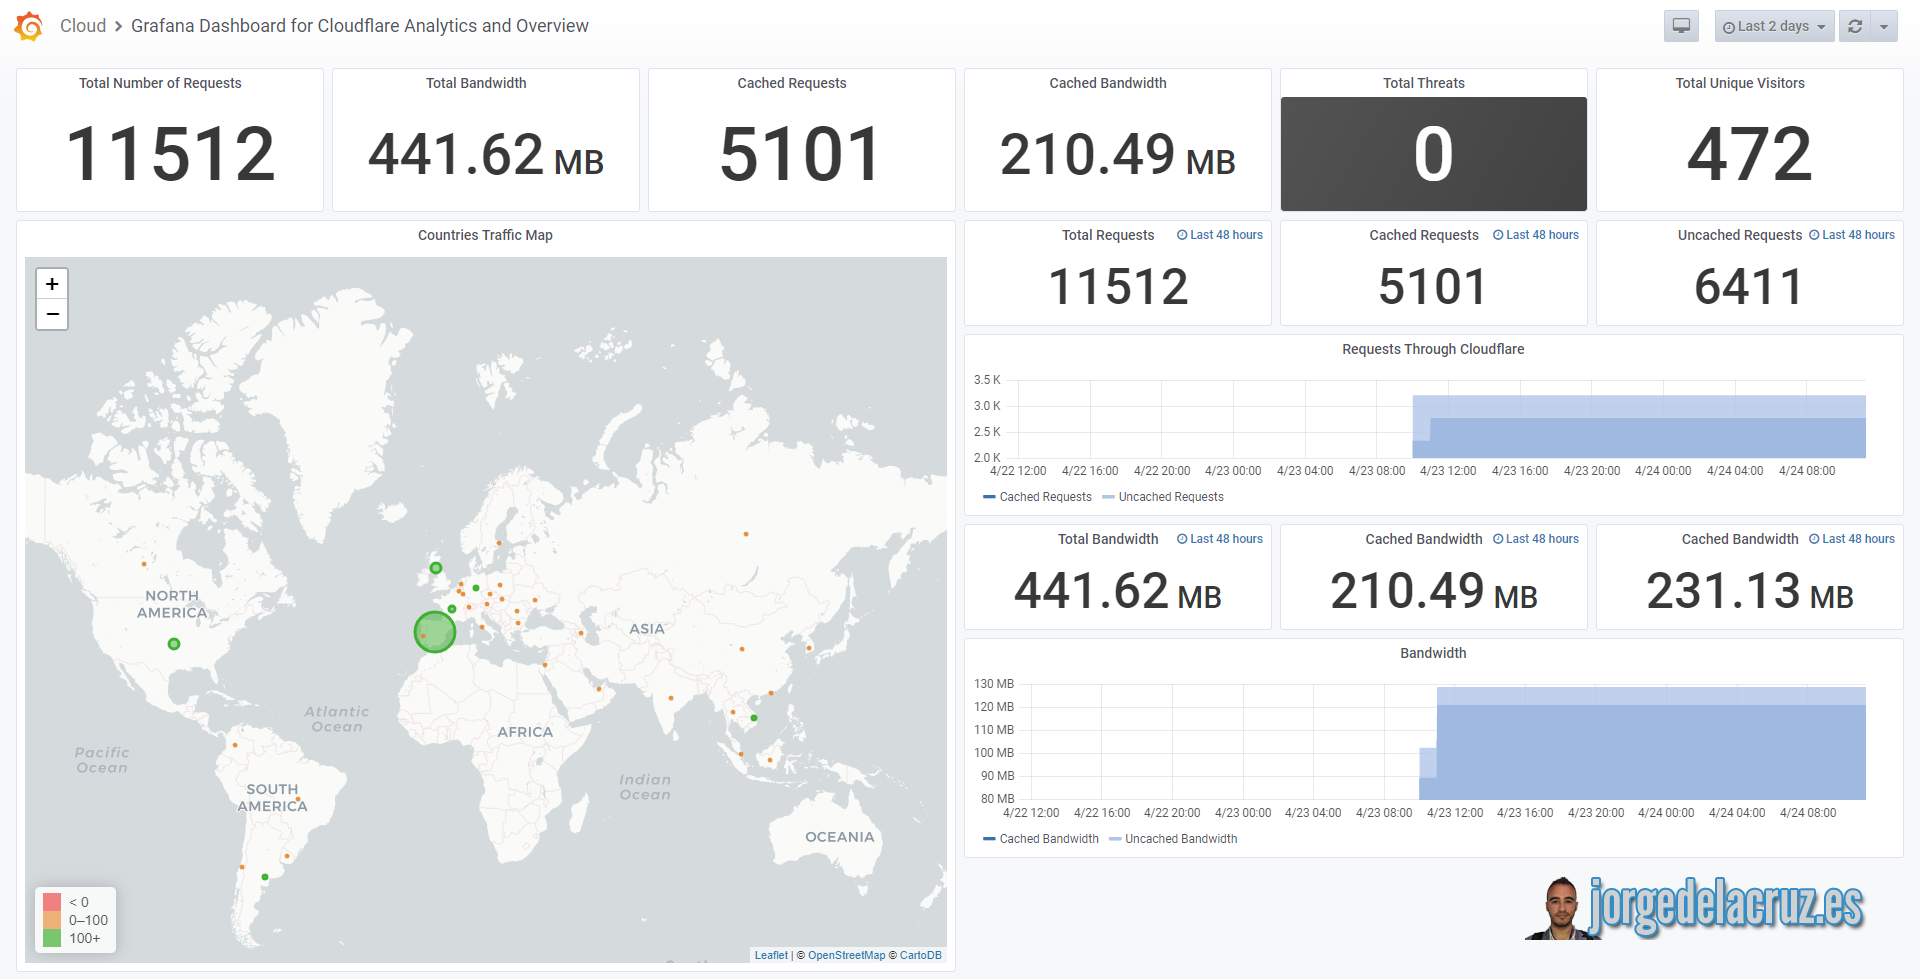
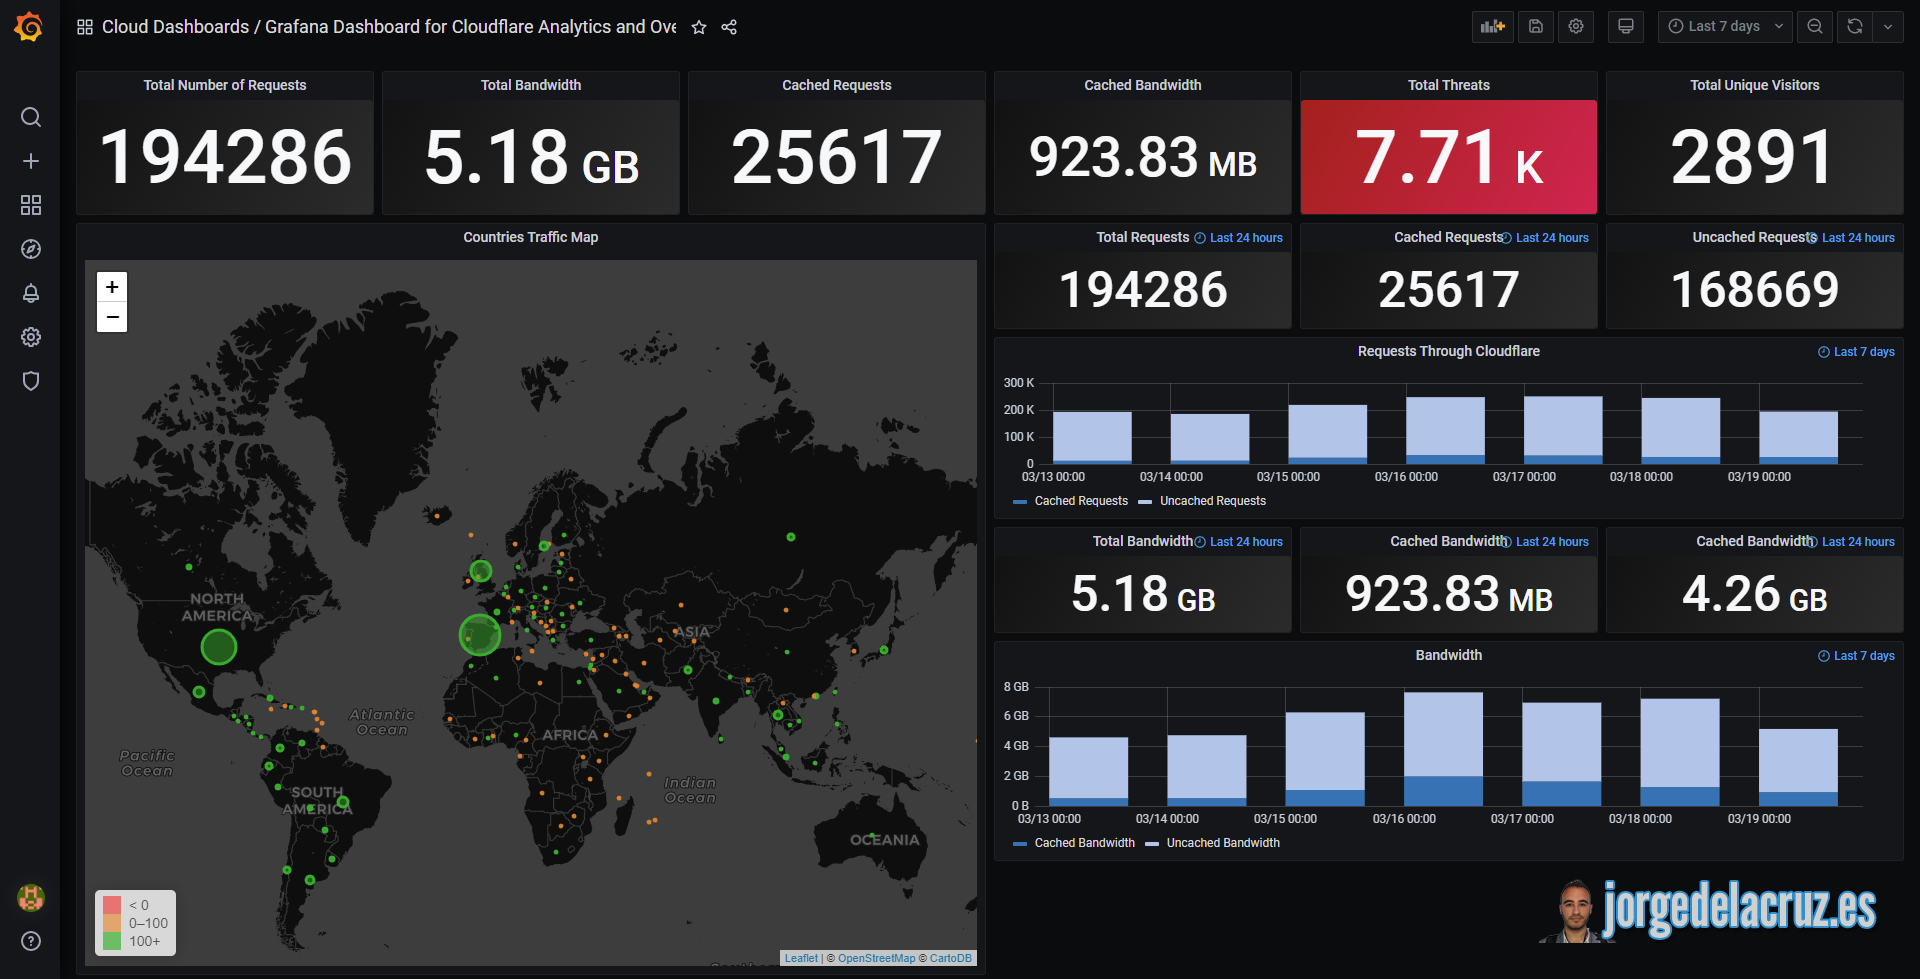
0 9 * * * /home/oper/cloudflare-analytics.sh >> /var/log/cloudflare.log 2>&1Then download or import this Dashboard to your Grafana, and you should see something similar to the next:

Data source config
Collector config:
Dashboard revisions
Upload an updated version of an exported dashboard.json file from Grafana
| Revision | Decscription | Created | |
|---|---|---|---|
| Download |
Get this dashboard
Data source:
Dependencies: