
Covid-19 Italy
Covid 19 spread in Italy using daily report from Protezione Civile repository.
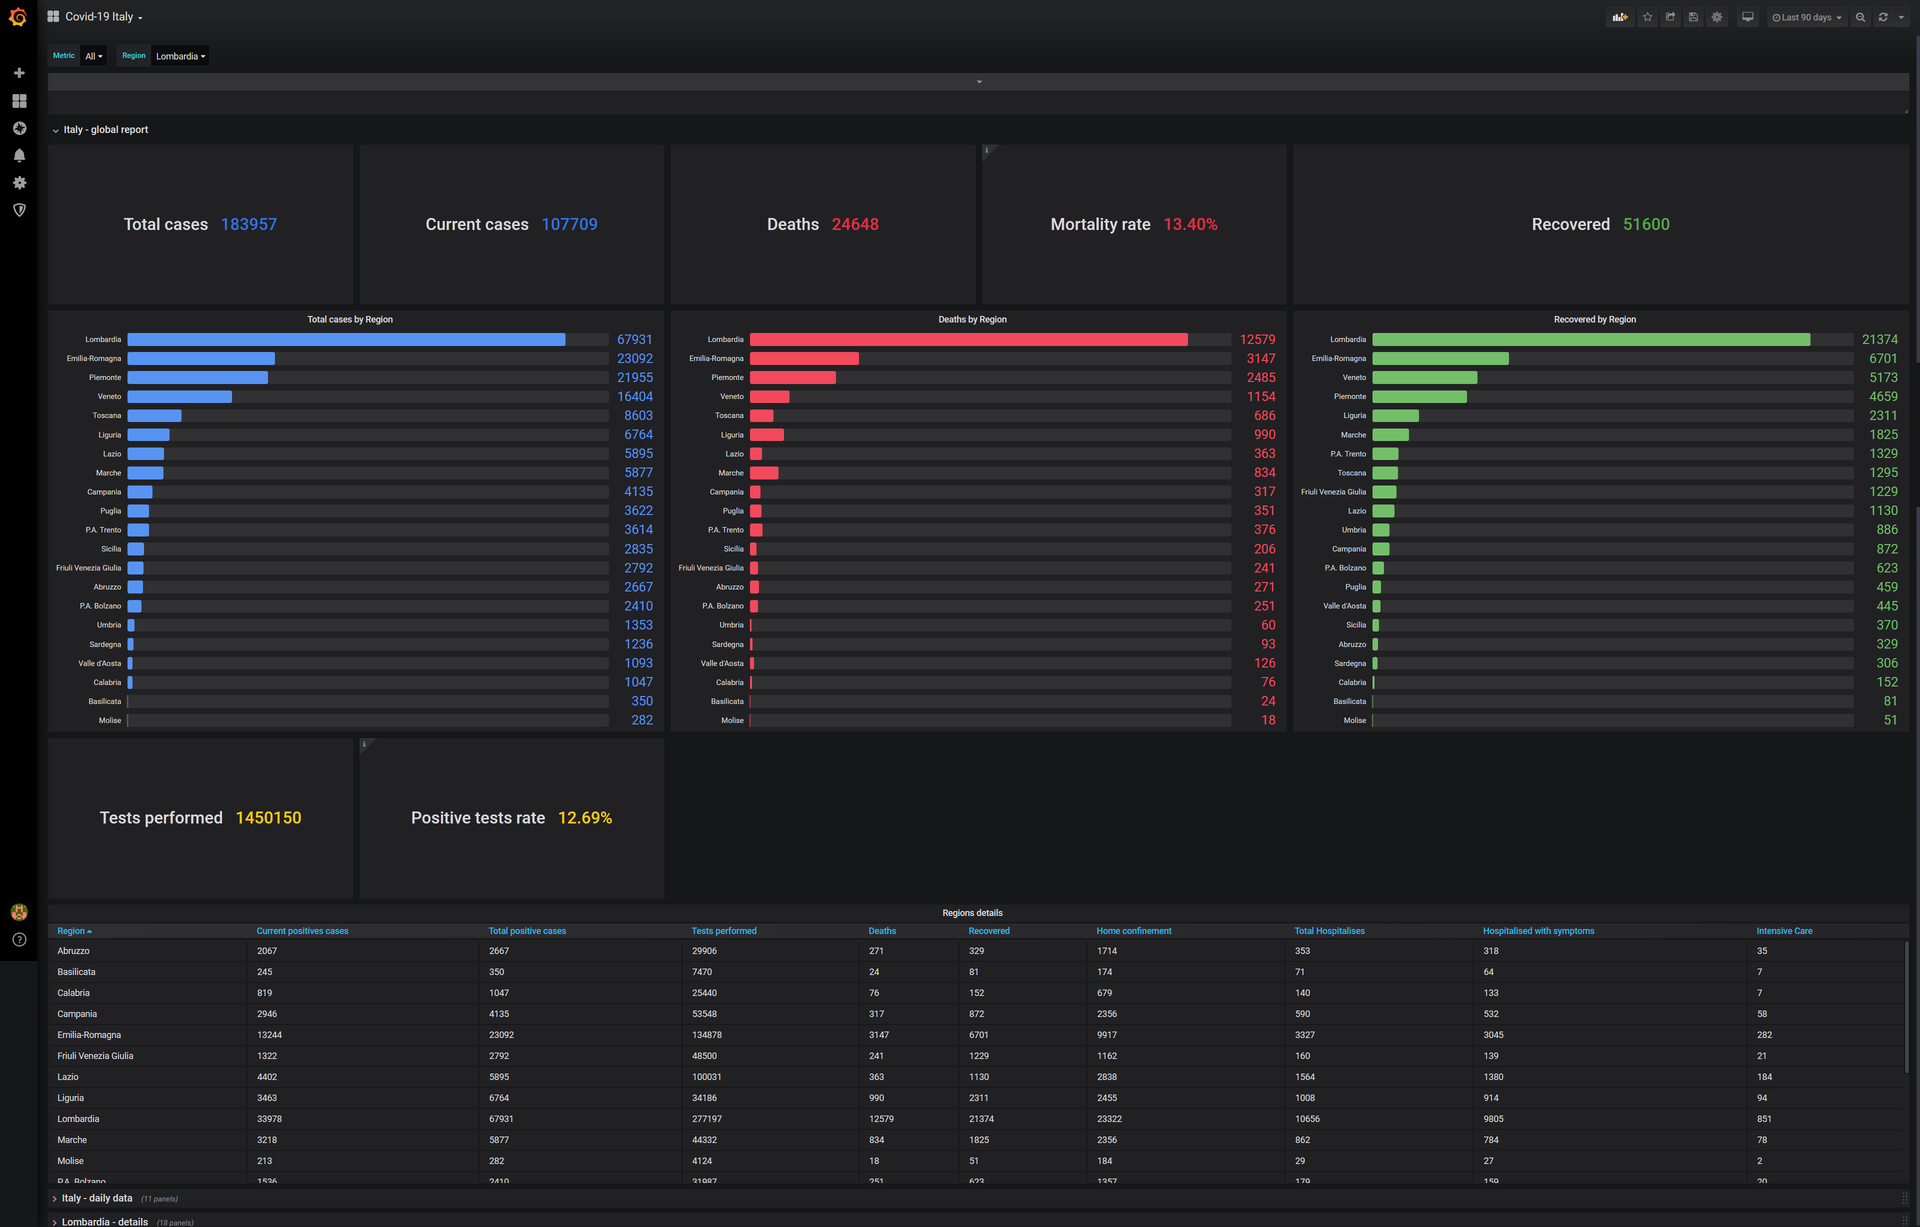
This dashboard shows data about spread of Covid-19 in Italy using the daily report published by Dipartimento della Protezione Civile.
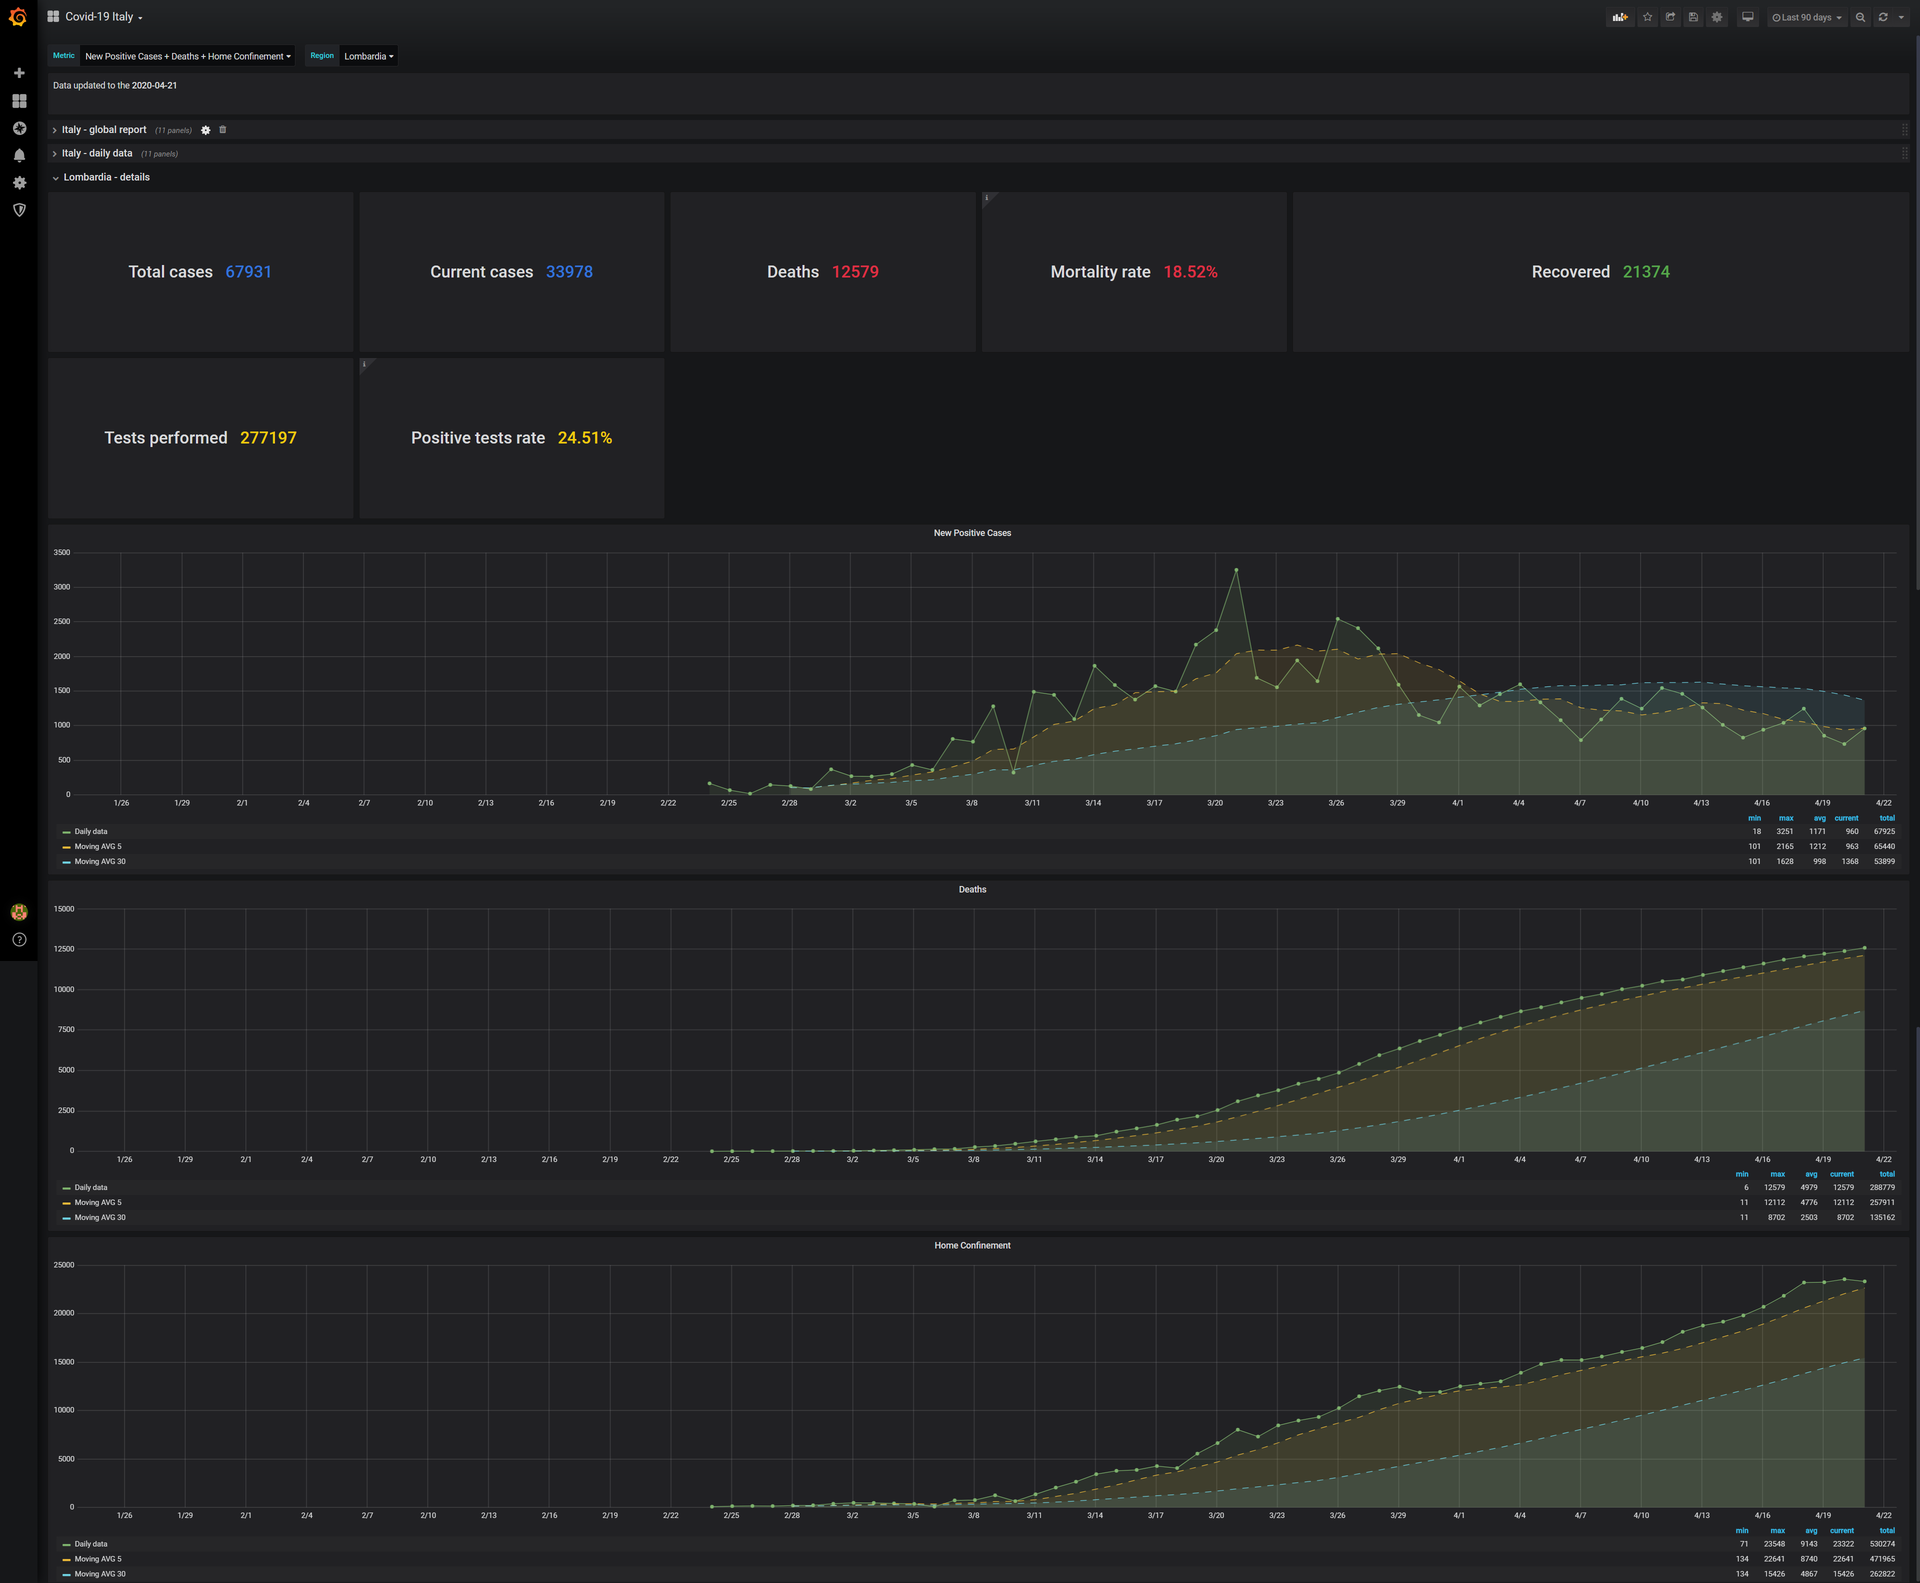
User can select a Region to see the details.
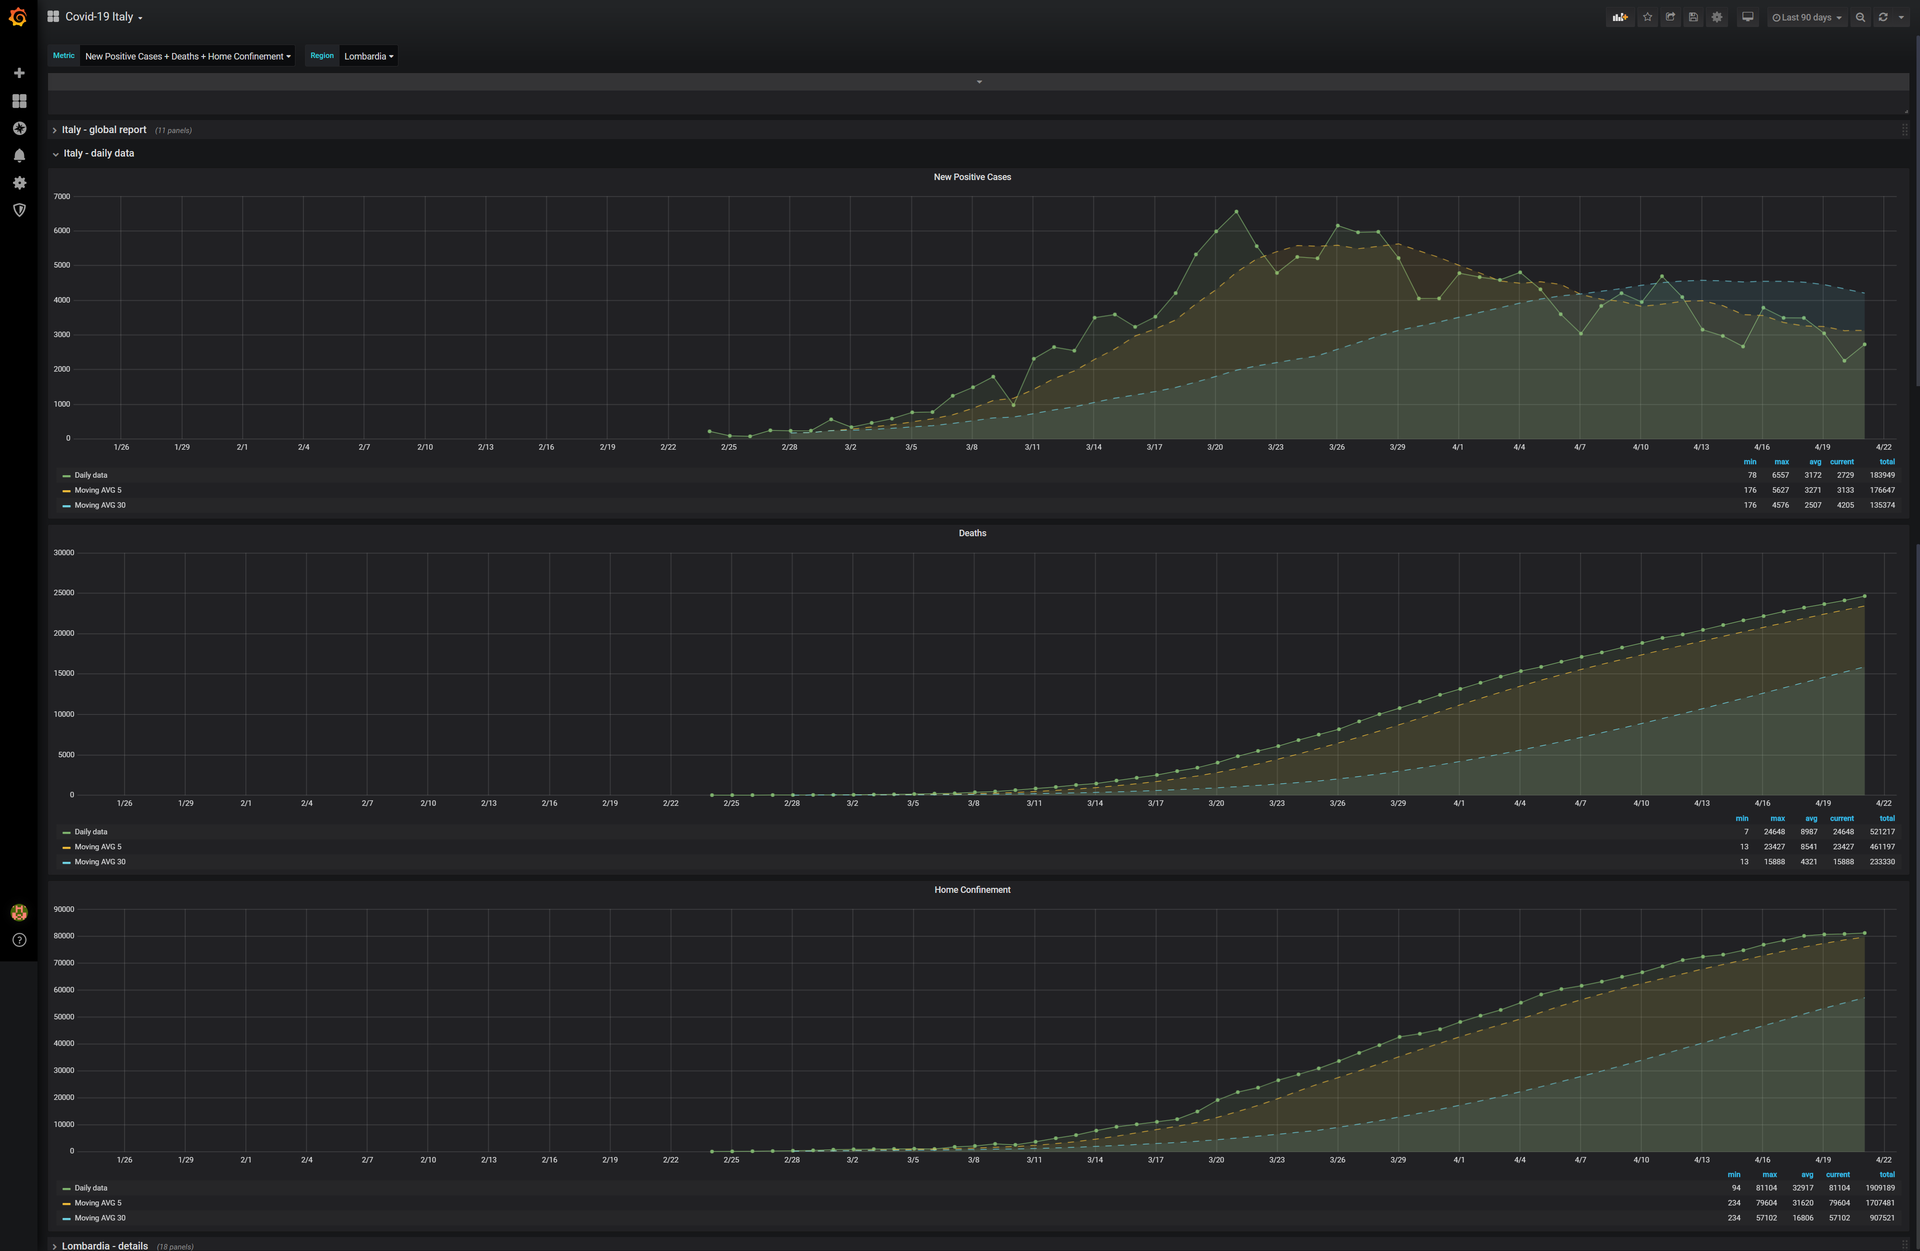
There a lot of metric, the user can choose a subset and plot only the required ones. For each metric, will be shown the time series with the moving average over 5 and 30 days.
You can find more details in my public GitHub repository nick990/grafana-dashboards in folder covid19-italy (TAG v2.0.0).
Quickstart
Follow the instructions in Readme in order to create the DB SQL and to populate it.
Data source config
Collector type:
Collector plugins:
Collector config:
Revisions
Upload an updated version of an exported dashboard.json file from Grafana
| Revision | Description | Created | |
|---|---|---|---|
| Download |