Locust for Prometheus
all locust infos in one page
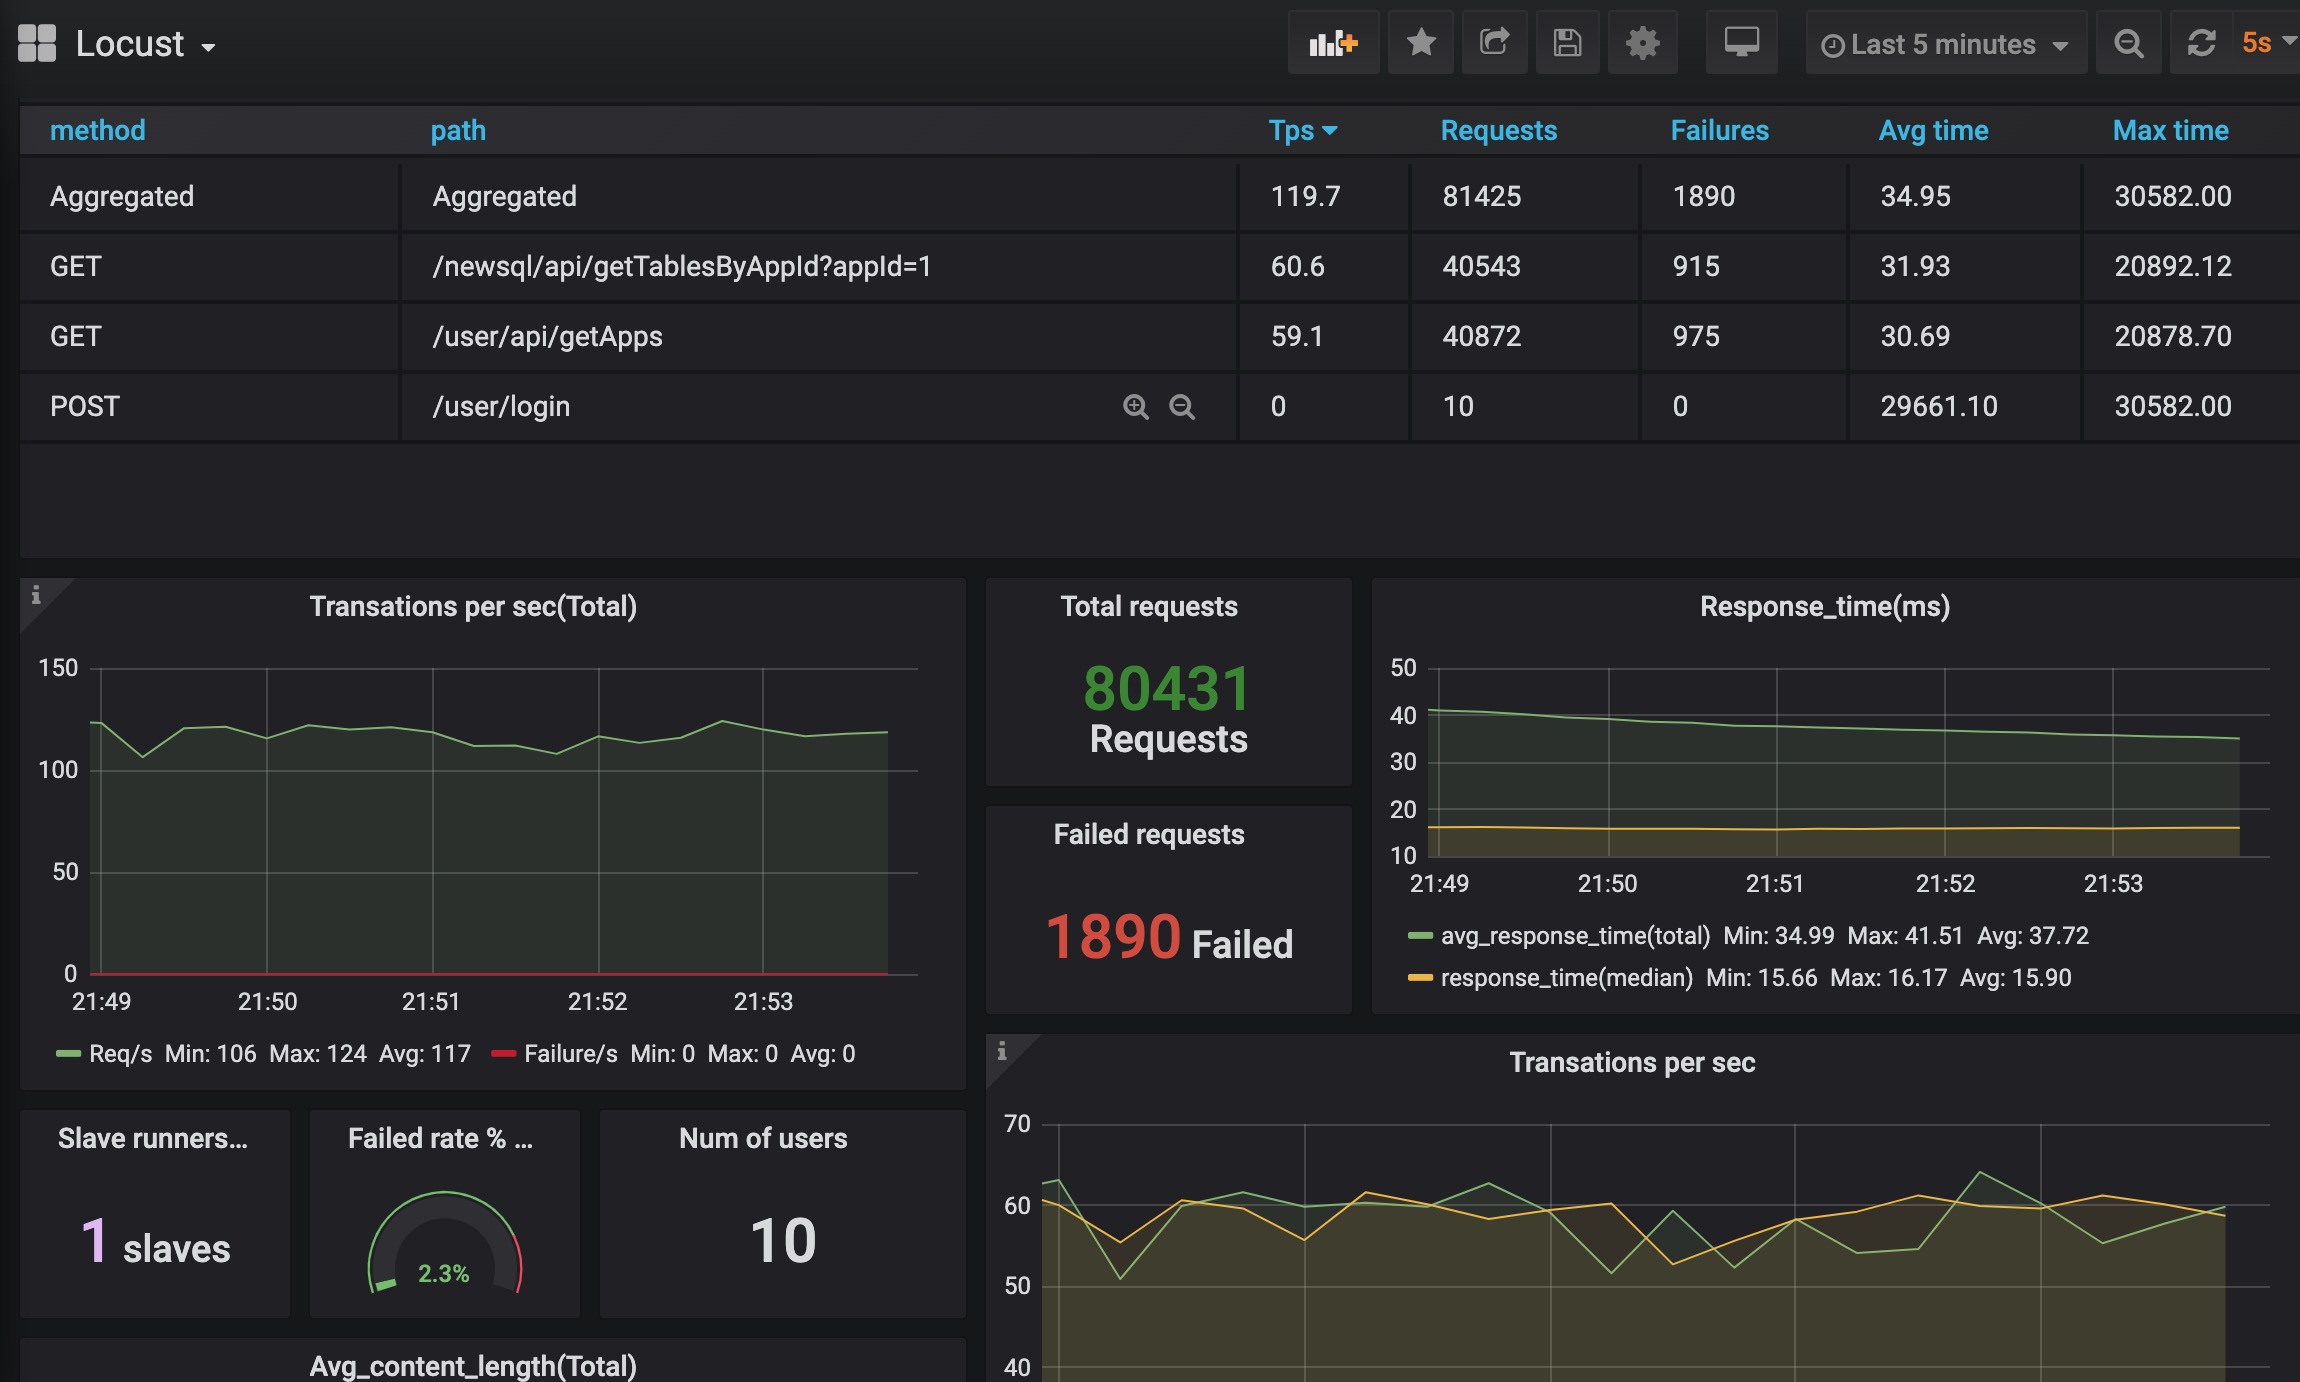
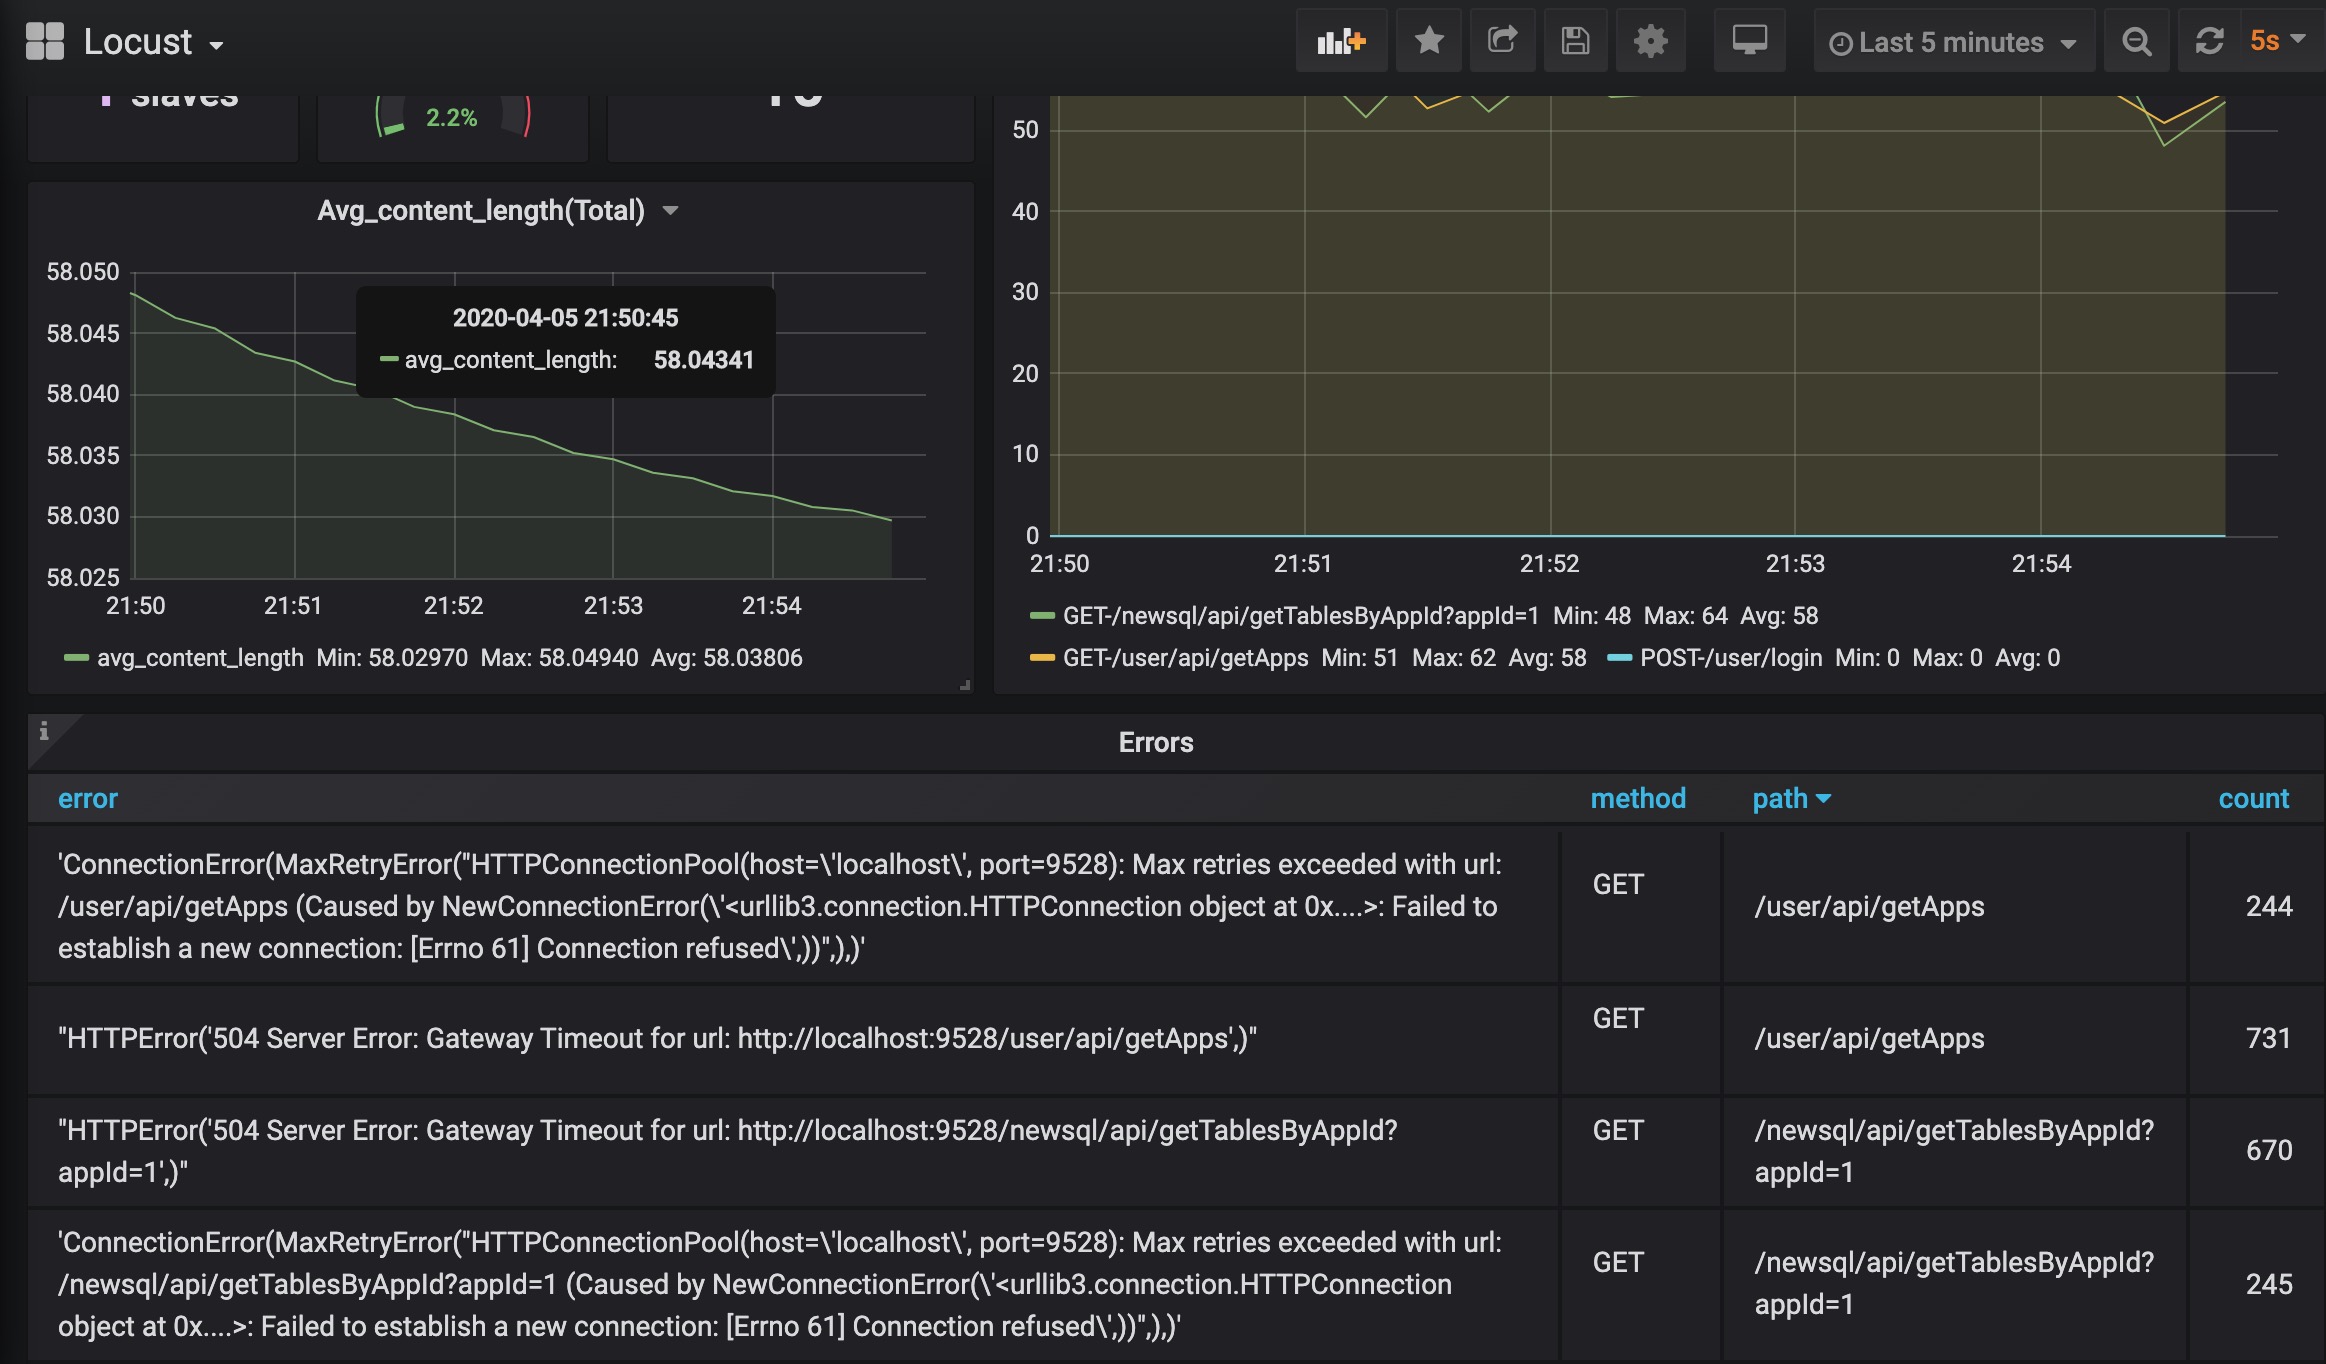
Prometheus collects metrics from Locust web monitor url /export/prometheus,Then Grafana shows them in Dashboard.
Details in https://bugvanisher.github.io/2020/04/05/locust-with-prometheus-and-grafana/
or
https://bugvanisher.cn/2020/04/05/locust-with-prometheus-and-grafana/
Data source config
Collector type:
Collector plugins:
Collector config:
Revisions
Upload an updated version of an exported dashboard.json file from Grafana
| Revision | Description | Created | |
|---|---|---|---|
| Download |
Metrics Endpoint (Prometheus)
Easily monitor any Prometheus-compatible and publicly accessible metrics URL with Grafana Cloud's out-of-the-box monitoring solution.
Learn more