Ceph Stats
Proxmox Ceph RBD Poolstatistics
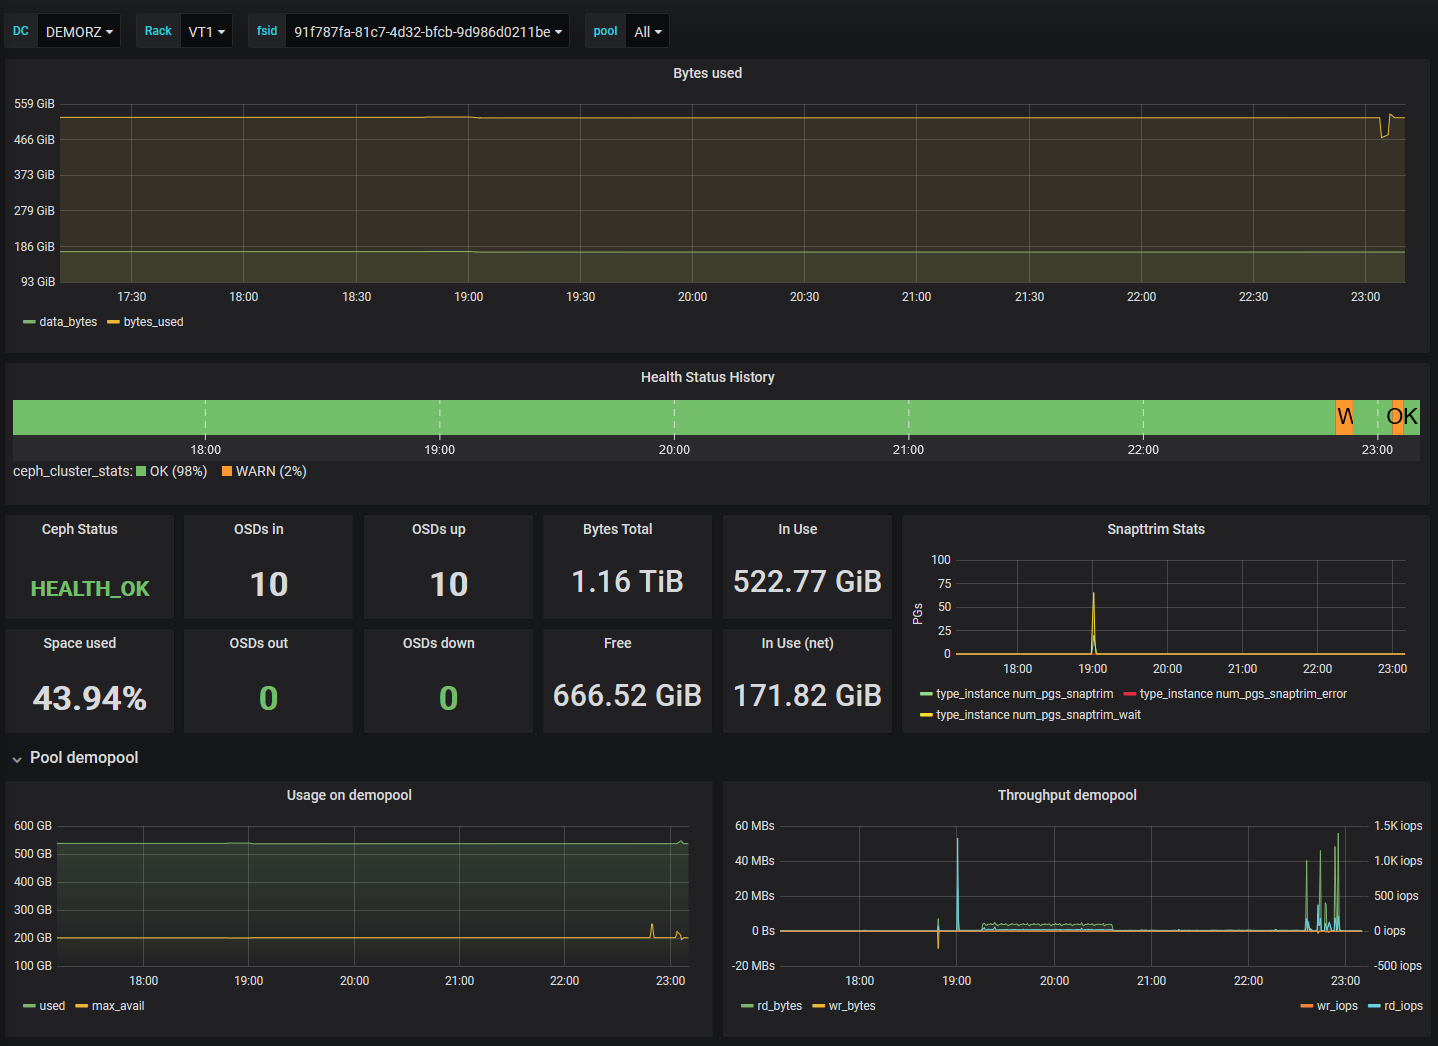
Dashboard + Telegraf Config for getting Pool Metrics from a Ceph Manager.
- Configure Ceph to expose Metrics:
ceph mgr module enable telegraf
ceph telegraf config-set address udp://:8094
ceph telegraf config-set interval 10
Important Hint: Execute those 3 commands in a row or you might run into a nasty Ceph bug that might cause your manager processes crashing: https://tracker.ceph.com/issues/43551
- Install Telegraf on all Nodes that run a Ceph manager Process.
- Copy the collector Config to every Host that runs a manager. Restart Telegraf on all nodes.
- Import Dashboard JSON to Grafana, assign Datasource.
Data source config
Collector type:
Collector plugins:
Collector config:
Revisions
Upload an updated version of an exported dashboard.json file from Grafana
| Revision | Description | Created | |
|---|---|---|---|
| Download |
Ceph
Monitor Ceph with Grafana. Easily keep tabs on your cluster with Grafana Cloud's out-of-the-box monitoring solution.
Learn more