CoreDNS
CoreDNS dashboard, focused on latency and cache-efficiency observability. Includes query and response time-series stack charts. Allows user to easily select both datasource and application (kube-dns, node-local-dns).
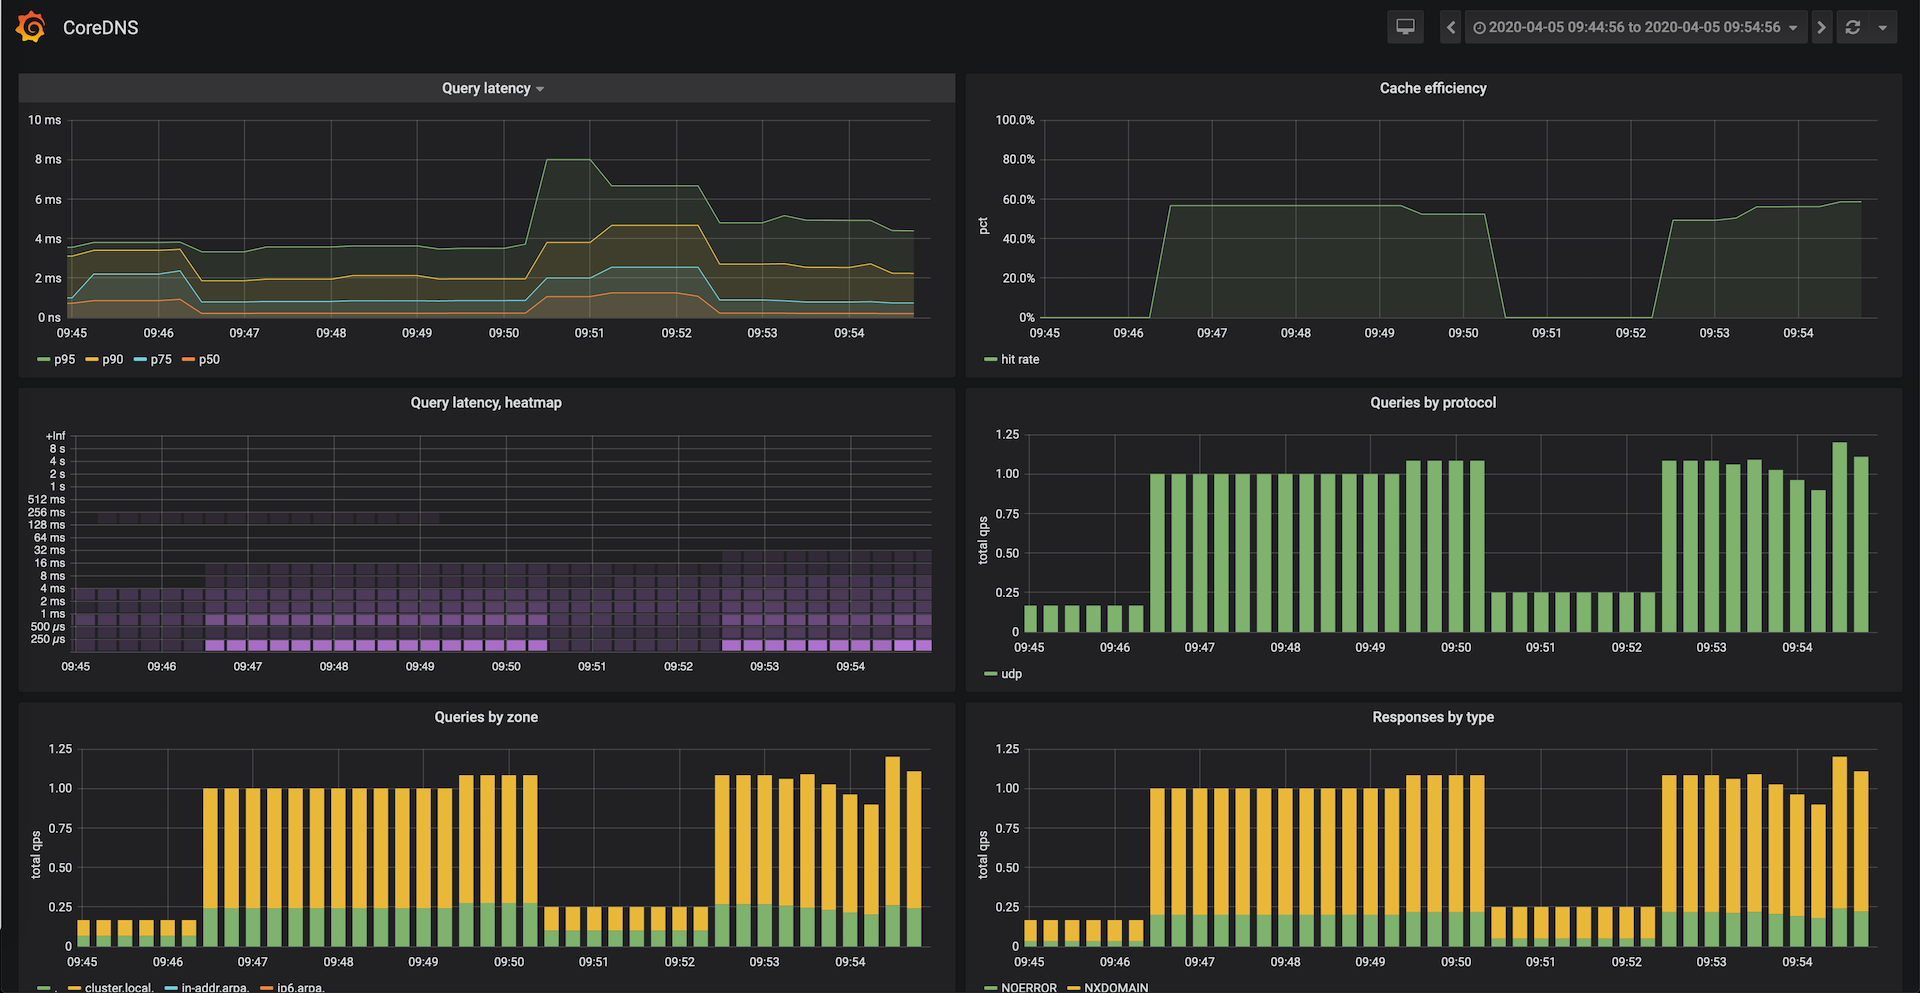
The CoreDNS dashboard uses the prometheus data source to create a Grafana dashboard with the graph and heatmap panels.
Data source config
Collector type:
Collector plugins:
Collector config:
Revisions
Upload an updated version of an exported dashboard.json file from Grafana
| Revision | Description | Created | |
|---|---|---|---|
| Download |
CoreDNS
Monitor CoreDNS with Grafana. Easily keep tabs on your DNS server with Grafana Cloud's out-of-the-box monitoring solution.
Learn more