Telegraf Internal Stats
Shows internal Telegraf metrics exposed to the Prometheus output plugin.
Requires:
[[inputs.internal]]
  collect_memstats = true
Uses:
- Grafana Prometheus datasource
- Telgraf Prometheus output plugin
- Telegraf vSphere input plugin (optional)
Shows:
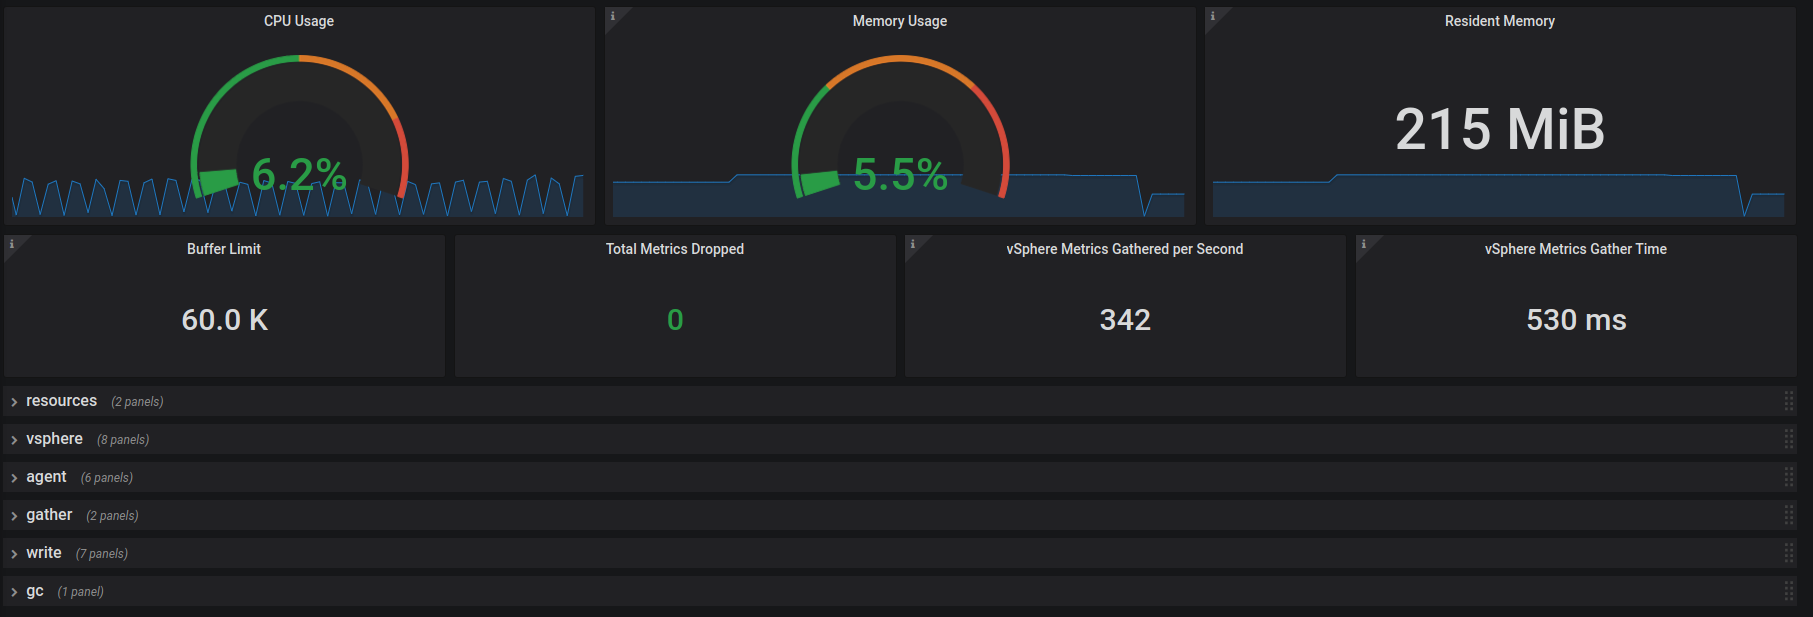
- General resource consumption overview
- vSphere input plugin metrics
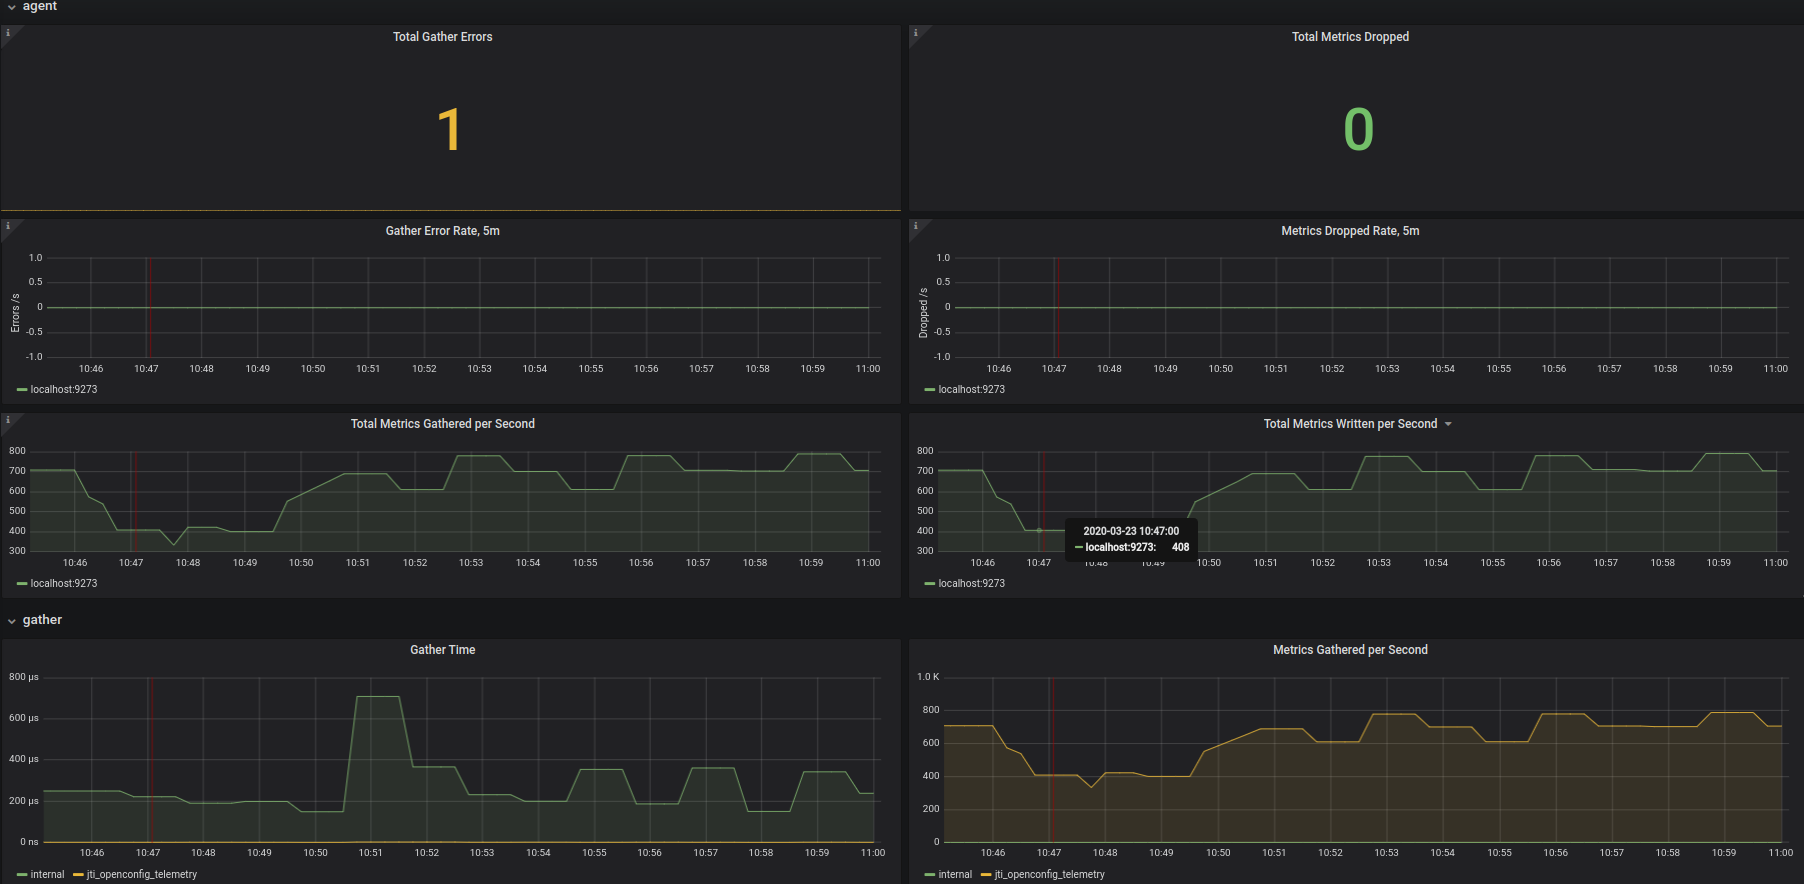
- Agent metrics
- Gather metrics
- Write metrics
- GC metrics
Data source config
Collector type:
Collector plugins:
Collector config:
Revisions
Upload an updated version of an exported dashboard.json file from Grafana
| Revision | Description | Created | |
|---|---|---|---|
| Download |