
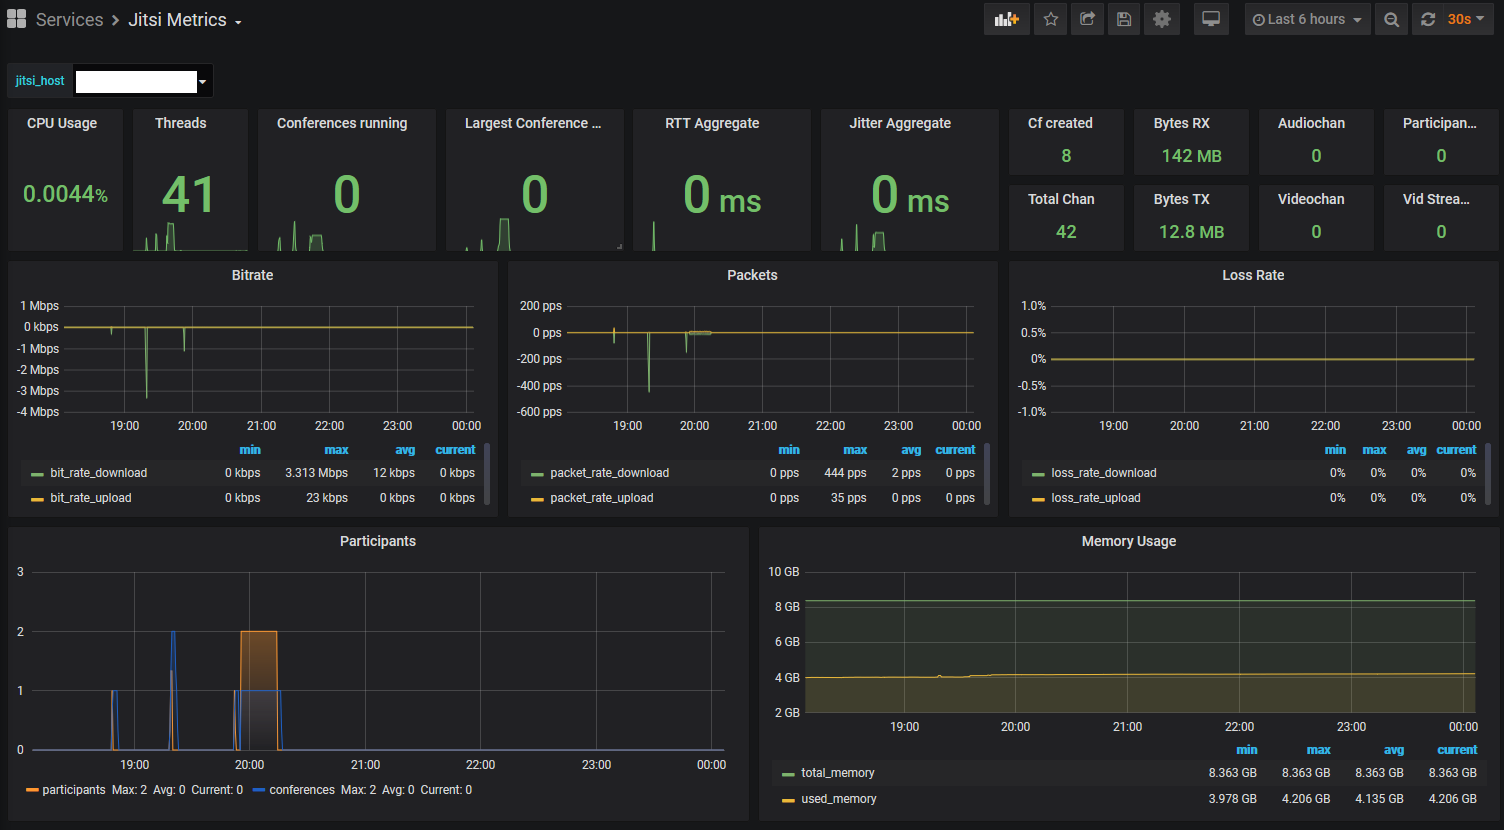
Jitsi Metrics
Videoconferencing Performance Metrics
Changes:
CPU and Memory usage have been removed since they’re no longer reported by the API. This is due a Jitsi Change.
Howto:
- Get JVB Metrics exposed. Enable the Colibri and REST API in JVB for that. In a common docker setup you would set JVB_ENABLE_APIS=rest,colibri.
Additionally you may want to expose port 8080 in your docker-compose.yml for service JVB. Care for security and Firewall that port if you don’t want dragons from the Internet to read your metrics.
- Put the config below in your telegraf config tree (eg.
/etc/telegraf/telegraf.d/jitsi.conf) + reload telegraf - Download the dashboard template, import it to your grafana instance and assign the matching InfluxDB datasource
- See nice numbers and graphs.
Data source config
Collector type:
Collector plugins:
Collector config:
Dashboard revisions
Upload an updated version of an exported dashboard.json file from Grafana
| Revision | Decscription | Created | |
|---|---|---|---|
| Download |
Sign up for Grafana Cloud

Get up and running in minutes with the Grafana Cloud free tier, which includes free forever 10k metrics, 50GB logs, 50GB traces, 500 VUh, and more.
Get this dashboard
Data source:
Dependencies: