
elasticsearch 5.x服务器监控面板
elasticsearch版本为5.0.1以上
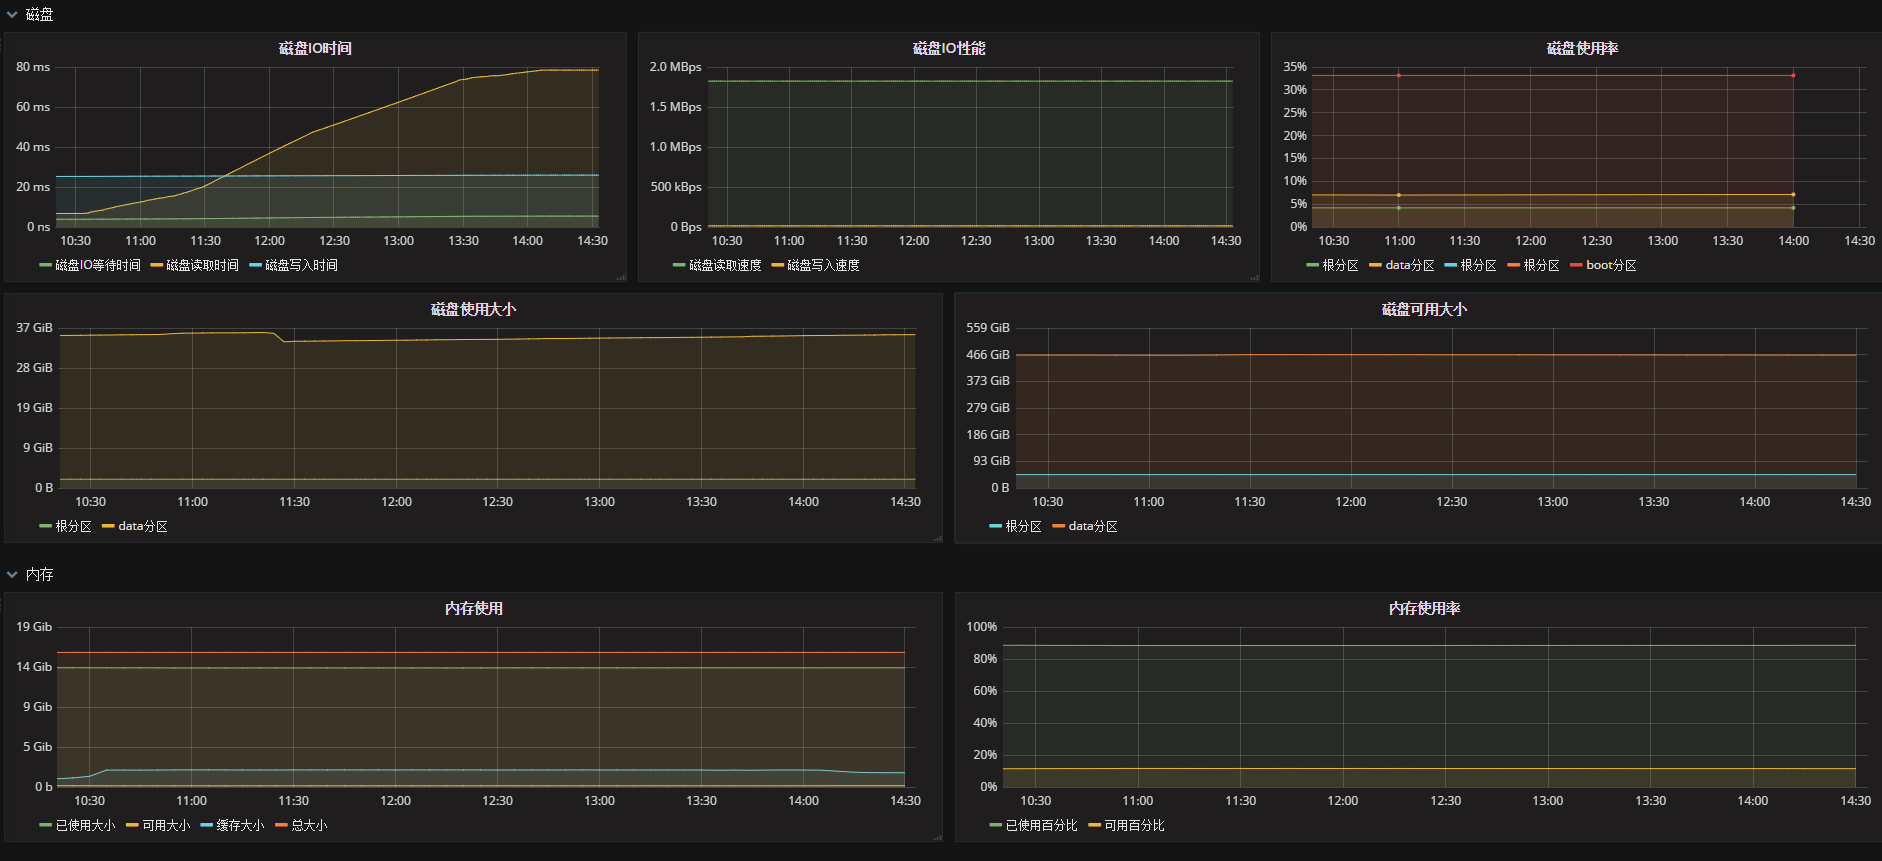
面板输出为服务器常用指标项,采集器为telegraf输出到kafka集群,通过kafka-connect-elastic插件消费数据到数据库,数据库版本为elasticsearch5.x系列
Data source config
Collector type:
Collector plugins:
Collector config:
Dashboard revisions
Upload an updated version of an exported dashboard.json file from Grafana
| Revision | Decscription | Created | |
|---|---|---|---|
| Download |
Sign up for Grafana Cloud

Get up and running in minutes with the Grafana Cloud free tier, which includes free forever 10k metrics, 50GB logs, 50GB traces, 500 VUh, and more.
Get this dashboard
Data source:
Dependencies: