
Routinator
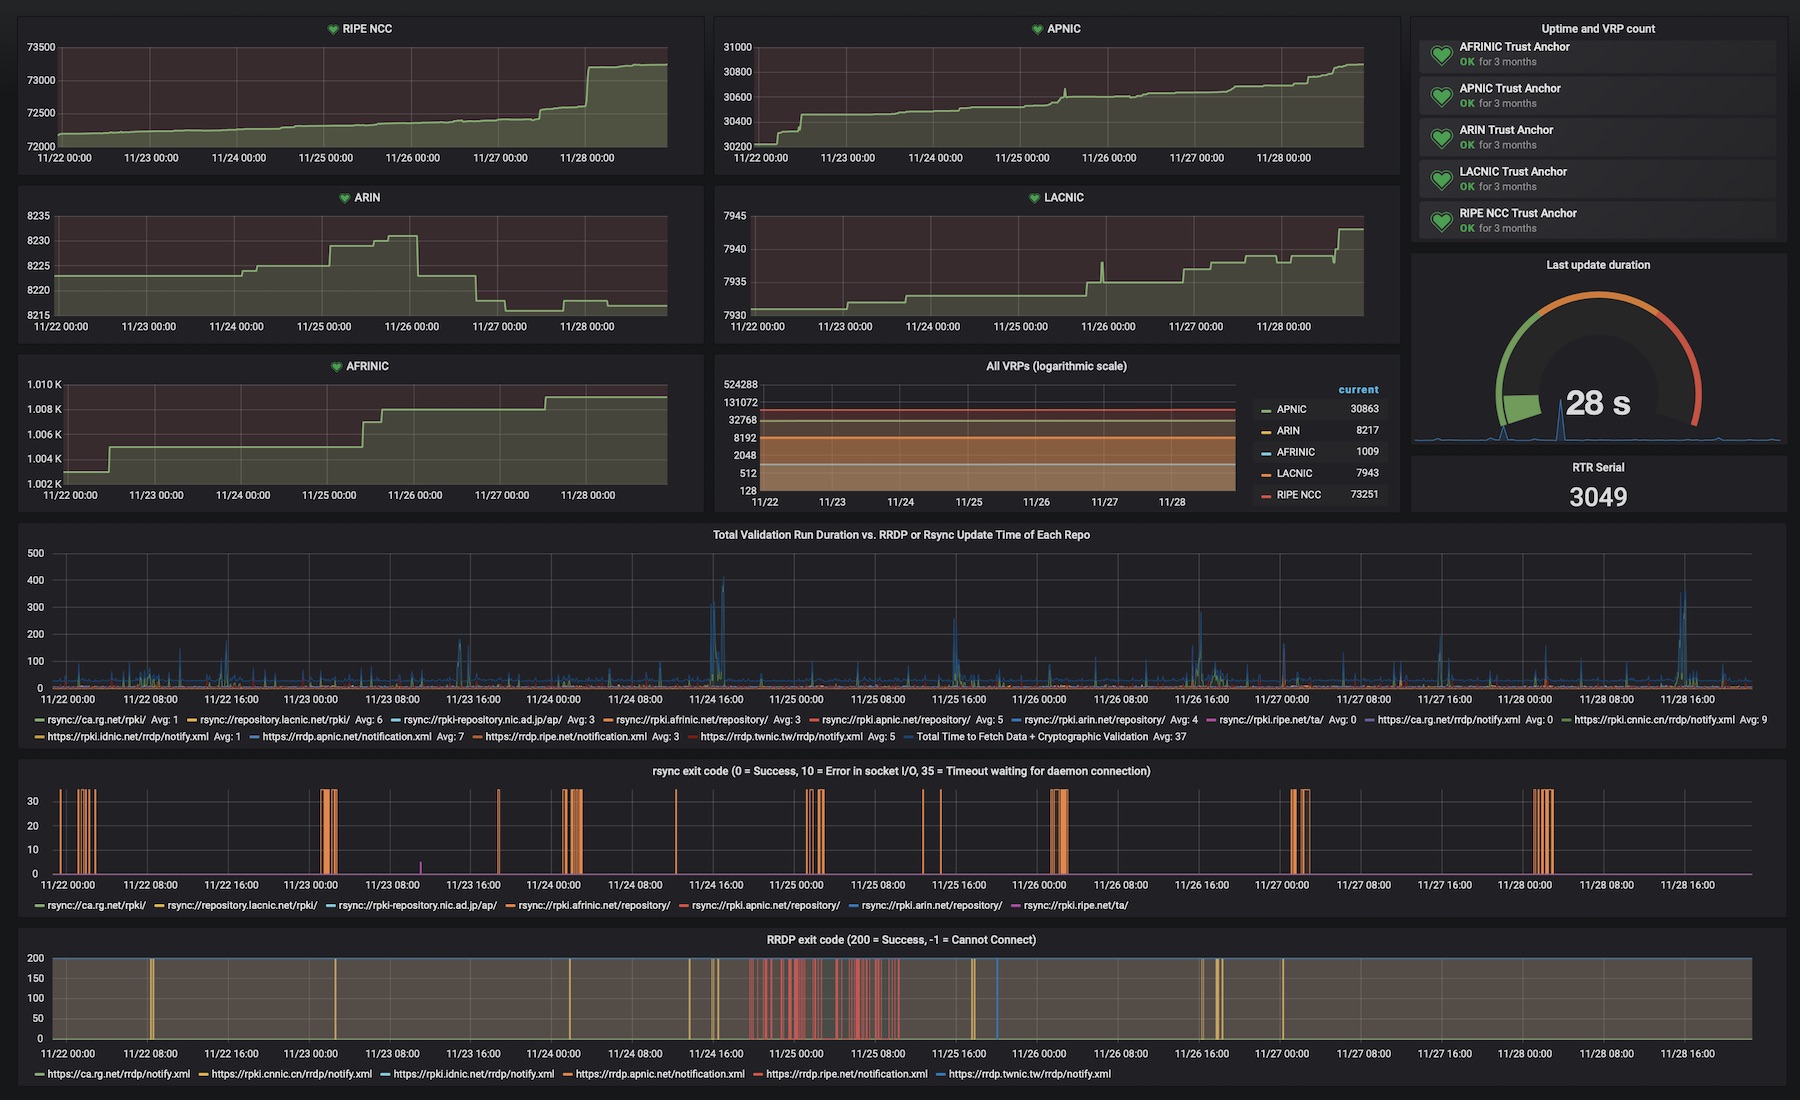
This dashboard provides trust anchor and repository statistics
The latest revision, updated on 22 April 2024, was contributed by Ludovic Ortega.
The HTTP server in Routinator provides a Prometheus endpoint for monitoring the health of the application itself, as well as all trust anchors and repositories. If you installed Routinator from a package, by default, Prometheus metrics will be exposed on port 8323.
On the /metrics path, Routinator will expose the number of valid ROAs seen for each trust anchor and repository and the total number of validated ROA payloads (VRPs) for each. In addition, several counters are available that indicate when the last update was started, when it finished and the duration. There are also stats for each repository.
The current serial number for RPKI-RTR is also exposed. This number is used to notify connected routers that new data is available. The number Routinator has should match the serial on your connected router. Lastly, the endpoint provides several gauges related to the duration of fetching the data in each RPKI repository.
Data source config
Collector config:
Dashboard revisions
Upload an updated version of an exported dashboard.json file from Grafana
| Revision | Decscription | Created | |
|---|---|---|---|
| Download |
Get this dashboard
Data source:
Dependencies: