dd-wrt SNMP
dd-wrt dashboard using SNMP data stored in Prometheus
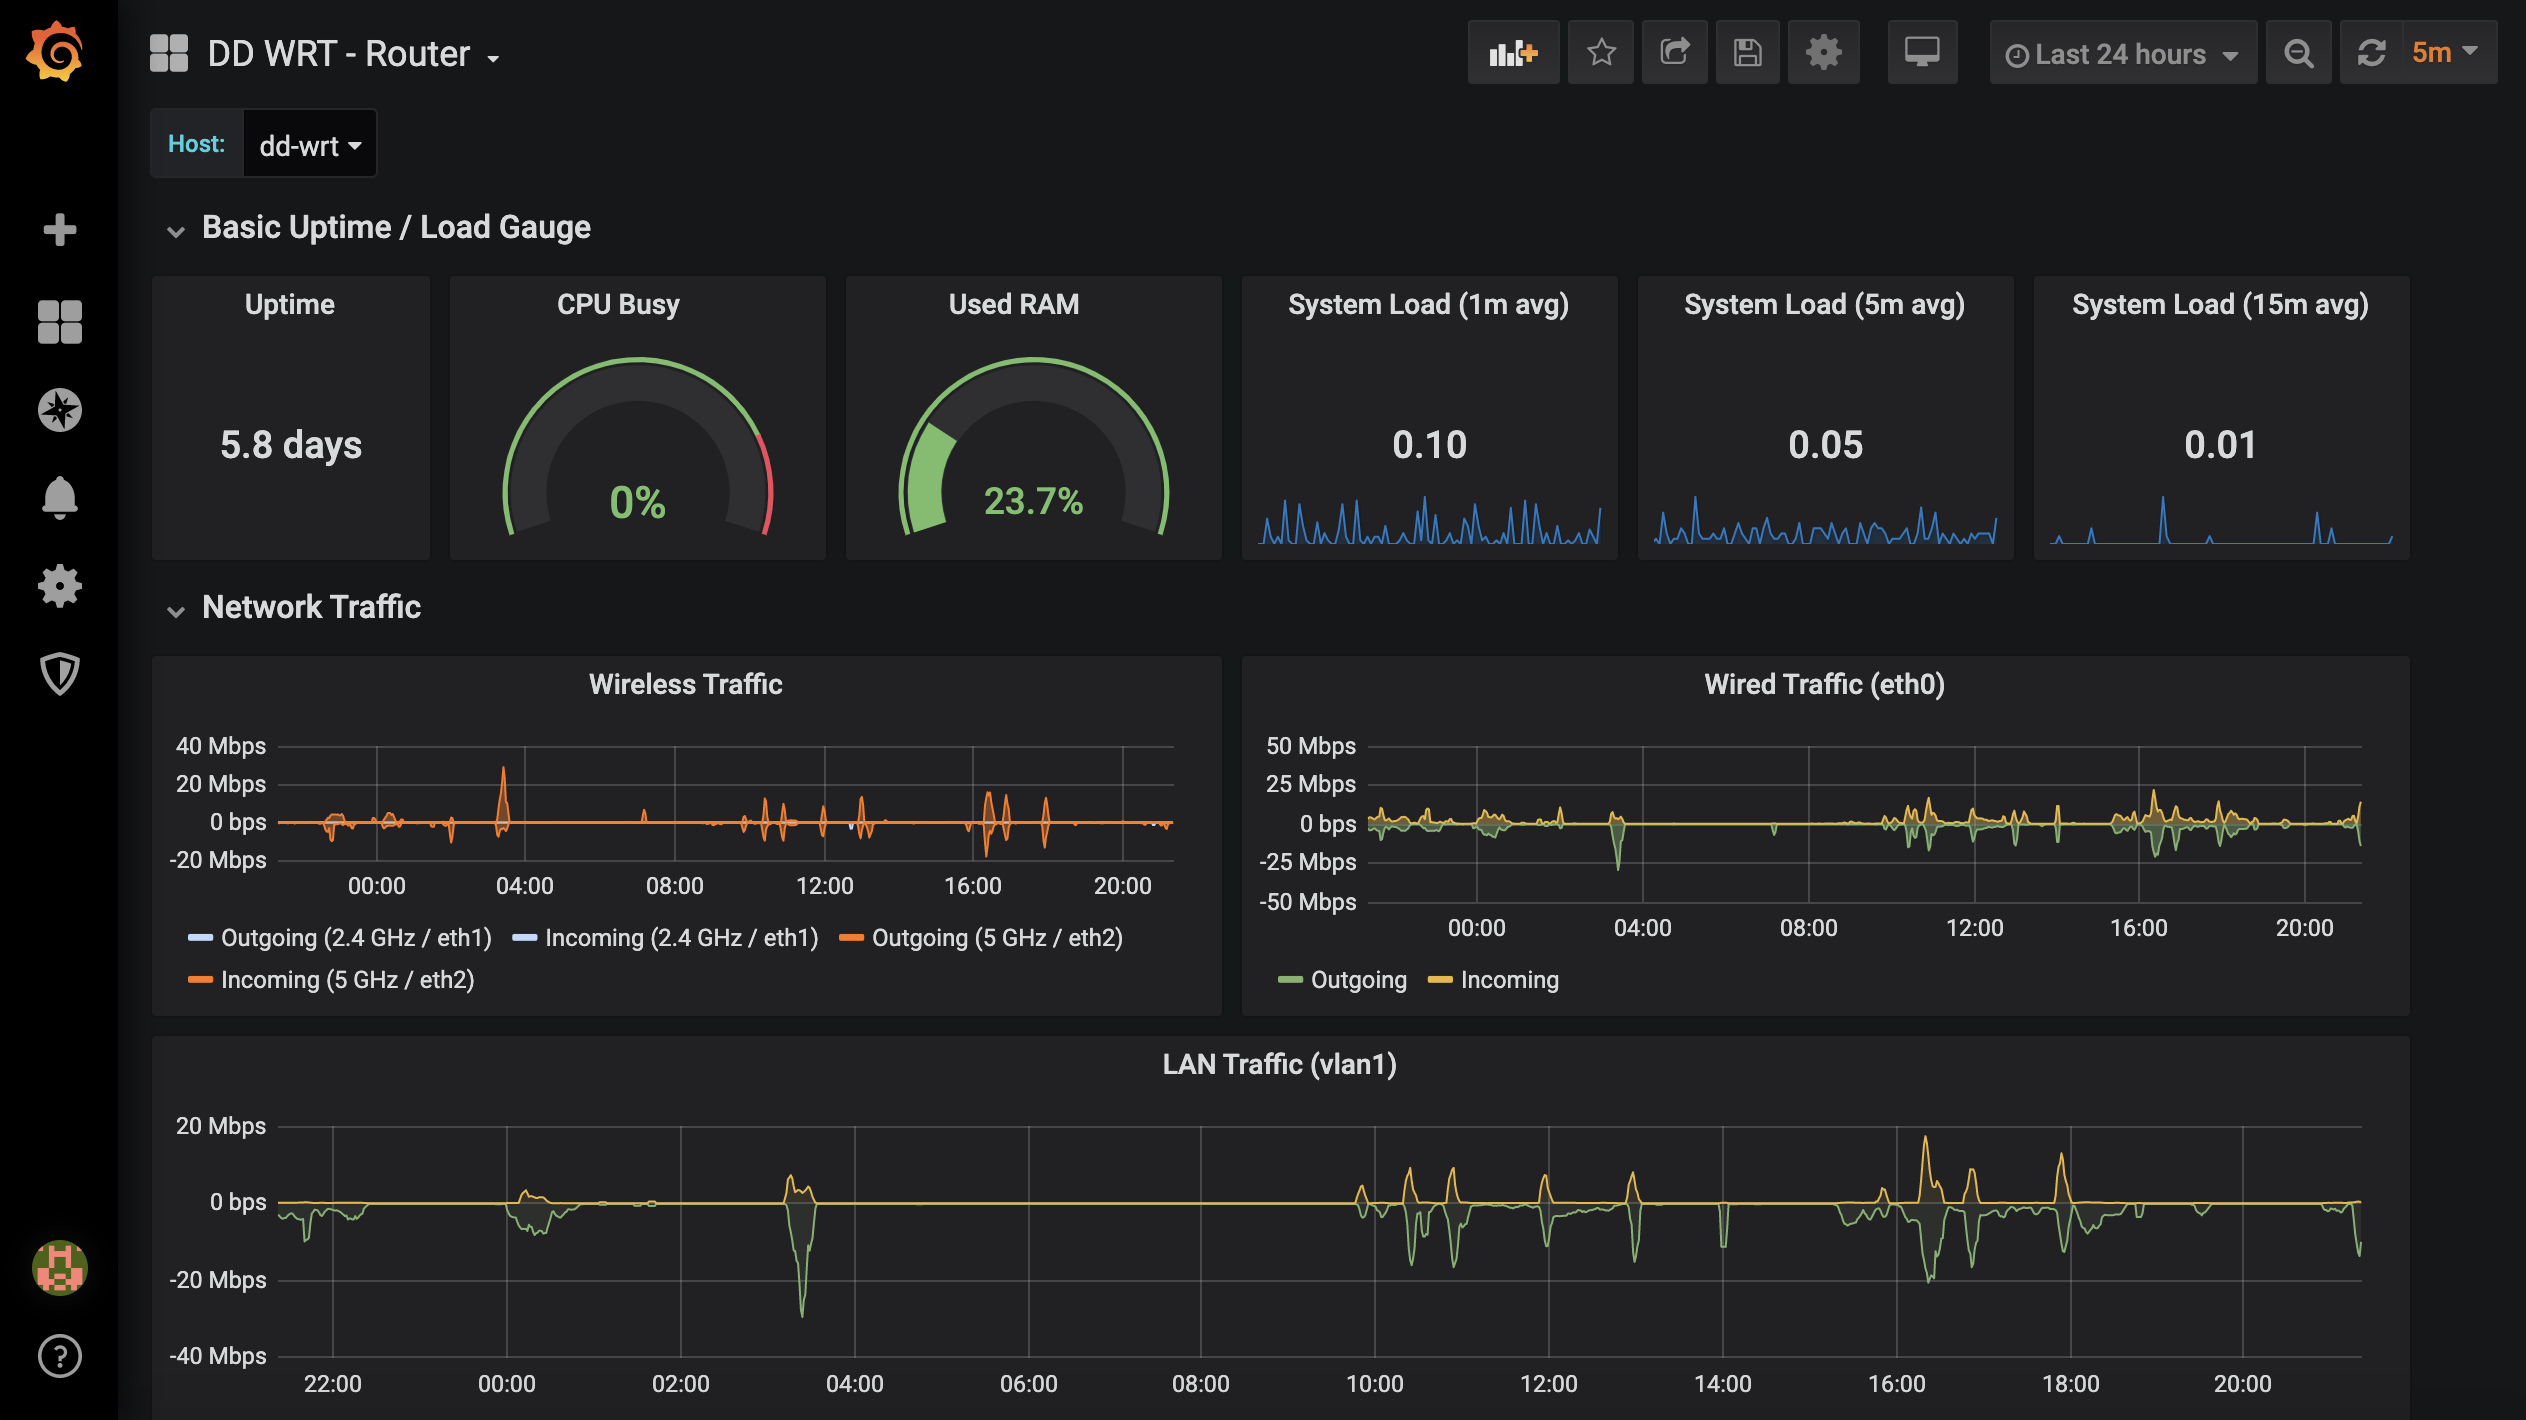
Basic monitoring of dd-wrt routers: uptime, load, cpu, basic memory usage, and network usage. SNMP data is collected with a basic prometheus/snmp_exporter setup.
Data source config
Collector type:
Collector plugins:
Collector config:
Revisions
Upload an updated version of an exported dashboard.json file from Grafana
| Revision | Description | Created | |
|---|---|---|---|
| Download |
SNMP
Easily monitor any generic SNMP (Simple Network Management Protocol) device with Grafana Cloud's out-of-the-box monitoring solution.
Learn more