
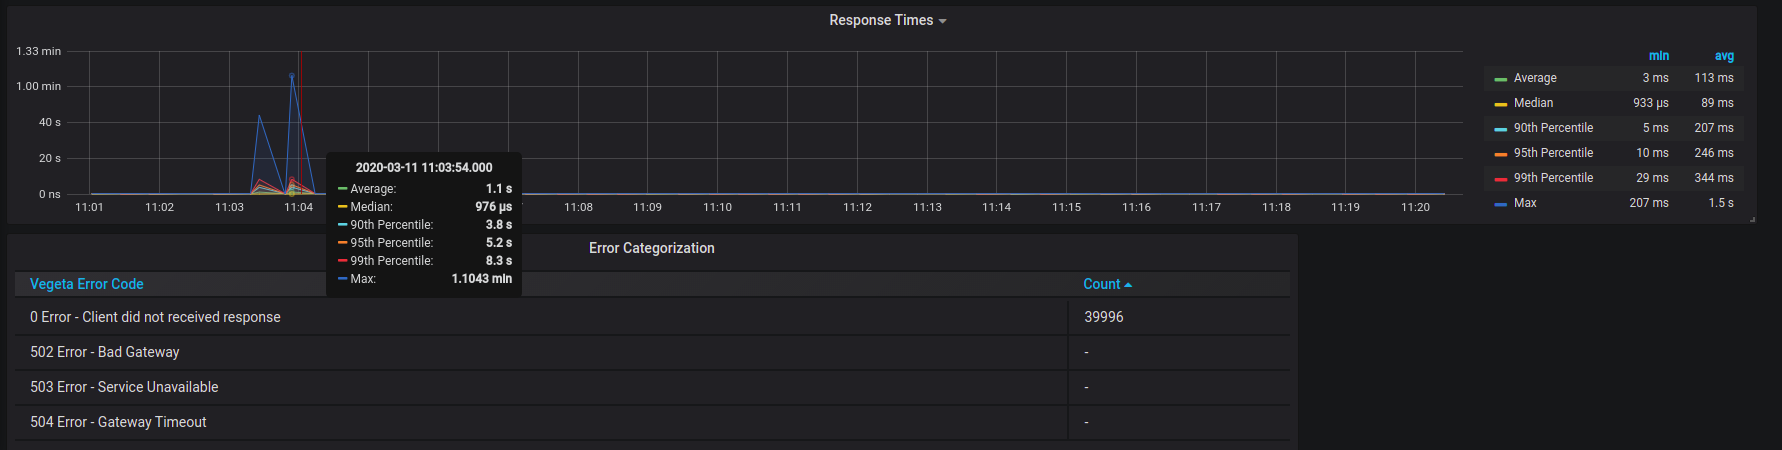
Vegeta Test Results with Logstash
Logstash, Elasticsearch base dashboard to visualize Vegeta performance test results.
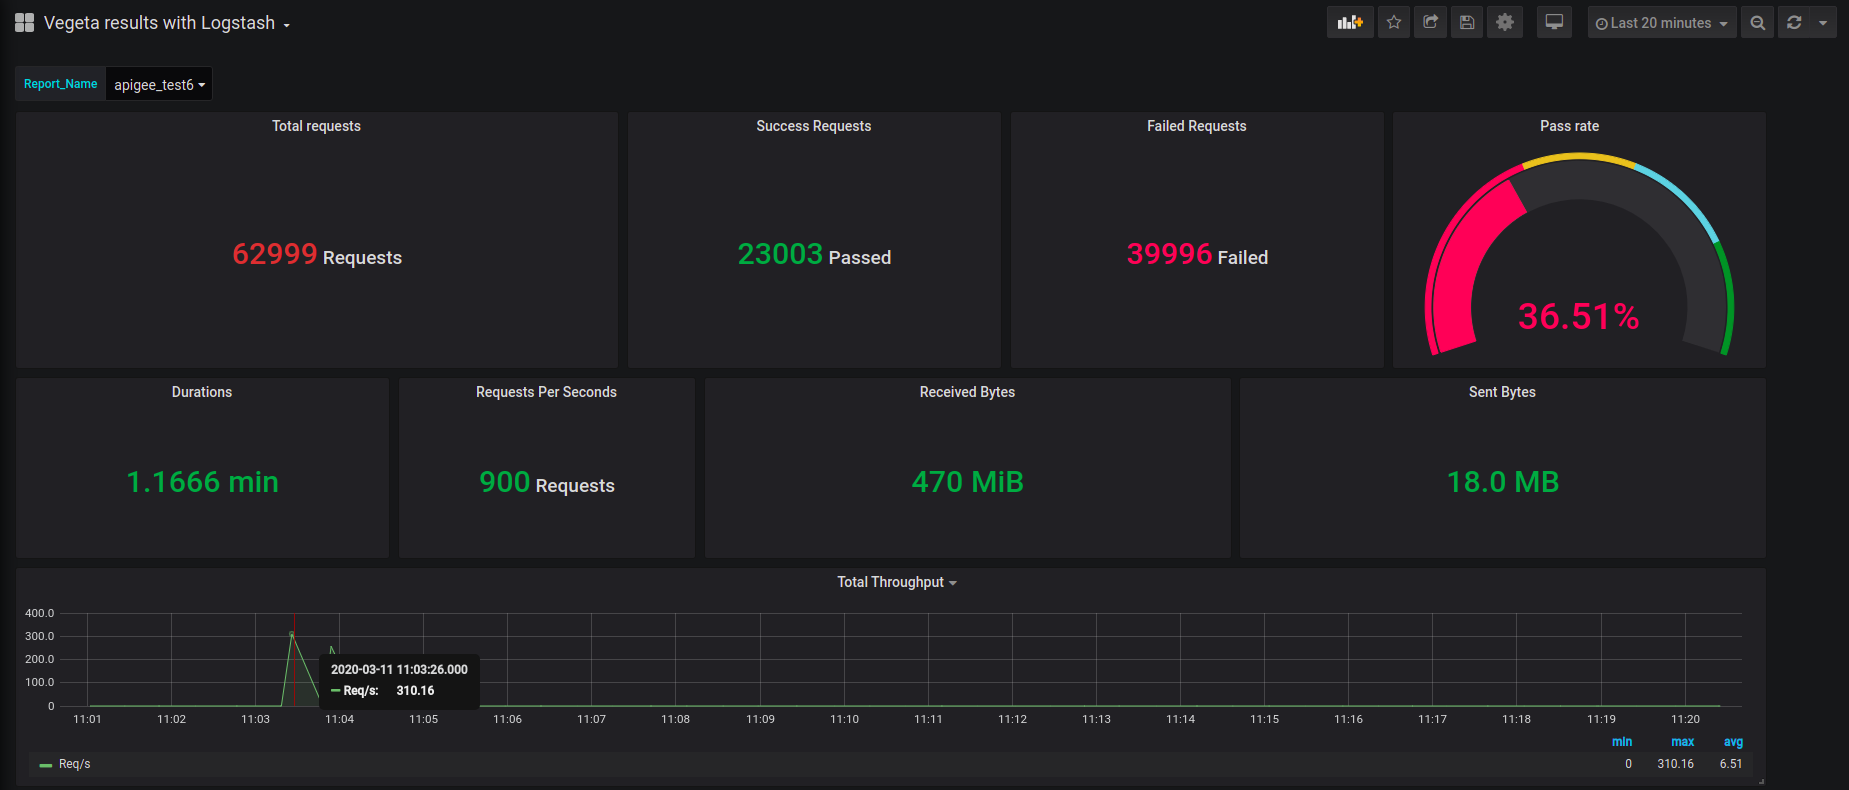
View your performance test results LIVE !!
- Install Logstash in your host server and feed Elasticsearch base (https://www.elastic.co/guide/en/logstash/6.8/index.html)
- Make sure you receive the data in ES base
- Grafana: Add the Elasticsearch source (https://grafana.com/docs/grafana/latest/features/datasources/elasticsearch/)
- Import the dashboard json into Grafana (https://grafana.com/docs/grafana/latest/reference/export_import/)
- Customise your dashboard
- Select the report name which you want to see by using the drop down
Logstash version: 7.6.0 Elasticsearch : v7.6.0 Grafana : v6.6.2
Collector Configuration Details
Logstash configuration :
input {
	file {
		path => "/vegeta/*.json"
		start_position => "beginning"
		codec => "json"
	}
}

filter {
	json {
		source => "message"
	}
	grok {
		match => ["path", "%{GREEDYDATA}/%{GREEDYDATA:report_title}\.json"]
	}
}


output {
	elasticsearch {
		hosts => ["localhost:9200"]
	}
	stdout {
		codec => rubydebug
	}
}
Vegeta run command:
- Download the latest Vegeta release (https://github.com/tsenart/vegeta)
- Run your vegeta command as follows:
echo "POST http://www.example.com" | vegeta attack -rate=100 -duration=90s | vegeta report -every=10ms -type=json -output=/vegeta/test.jsonData source config
Collector type:
Collector plugins:
Collector config:
Dashboard revisions
Upload an updated version of an exported dashboard.json file from Grafana
| Revision | Decscription | Created | |
|---|---|---|---|
| Download |
Sign up for Grafana Cloud

Get up and running in minutes with the Grafana Cloud free tier, which includes free forever 10k metrics, 50GB logs, 50GB traces, 500 VUh, and more.
Get this dashboard
Data source:
Dependencies: