HTTP Response Monitoring
A very simple and visual Dashboard to monitor HTTP Responses using the native http_response from Telegraf. It just works automatically once the sources are added to telegraf.
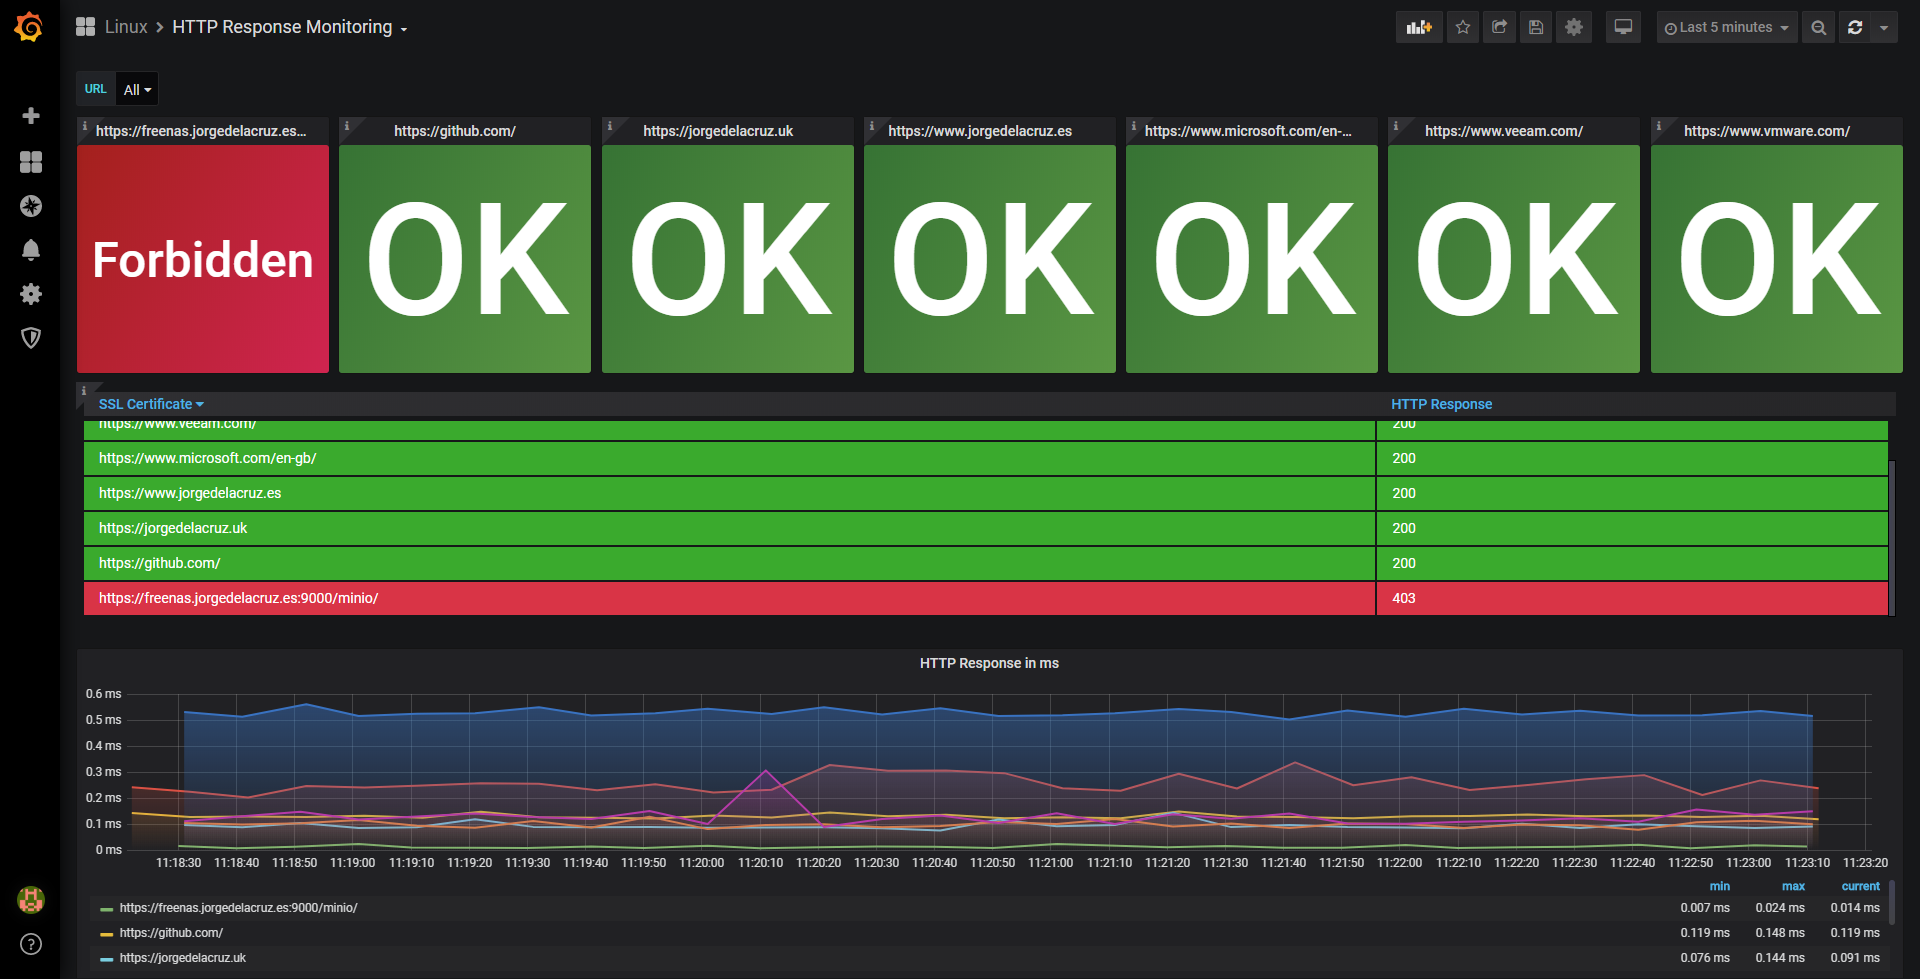
This very simple dashboard helps your Organization to monitor your active HTTP/HTTPS Websites in seconds, with crystal clear view of the status of all of them.
Using the latest version of Telegraf should work, more information here

Data source config
Collector type:
Collector plugins:
Collector config:
Revisions
Upload an updated version of an exported dashboard.json file from Grafana
| Revision | Description | Created | |
|---|---|---|---|
| Download |
Apache HTTP Server
Easily monitor Apache HTTP Server, an open source HTTP server for modern operating systems including UNIX and Windows, with Grafana Cloud's out-of-the-box monitoring solution.
Learn more