Curity Identity Server
Curity Identity Server
Curity Identity Server publishes Prometheus style metrics. Use this Grafana Dashboard to visualize the most important metrics. Just configure a Prometheus data source in Grafana that is set up to scrape metrics from the Curity Identity Server. Then simply import the sashboard and explore the metrics.
Note: Since revision 8 this dashboard is configured to work with versions of the Curity Identity Server from 7.4. onwards. For previous versions of the Curity Identity Server use revision 7 of the dashboard.
Updates
The dashboard was updated to Grafana 9.6.1 and the old graph panel was replaced by time series. Rate queries now make use of the $__rate_interval variable.
Some queries of the dashboard were simplified. For example, the dashboard now summarizes memory areas and shows a graph for heap and non-heap memory providing a better overview. Also, SSO rate and Login rate show a summary for each authentication method (ACR) over all instances (instead of for every single instance).
A new section for metrics related to JDBC data sources was introduced that provides an overview such as the work load or processing time of an JDBC data source. This feature was introduced in Curity Identity Server 7.4.
Structure of the Dashboard
The Dashboard is divided into several sections.
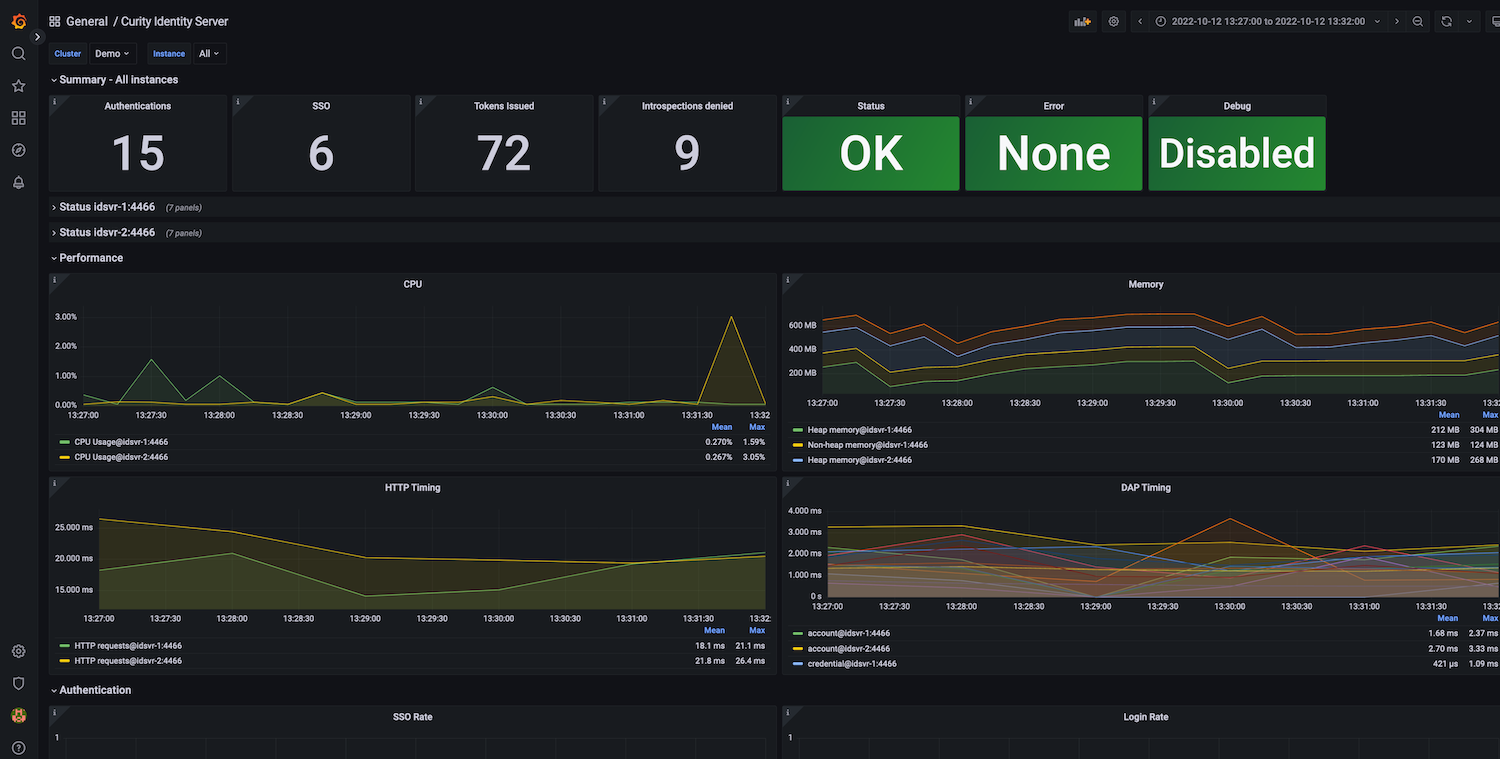
- On the top there is a summary of all instances of Curity Identity Server targeted by the datasource.
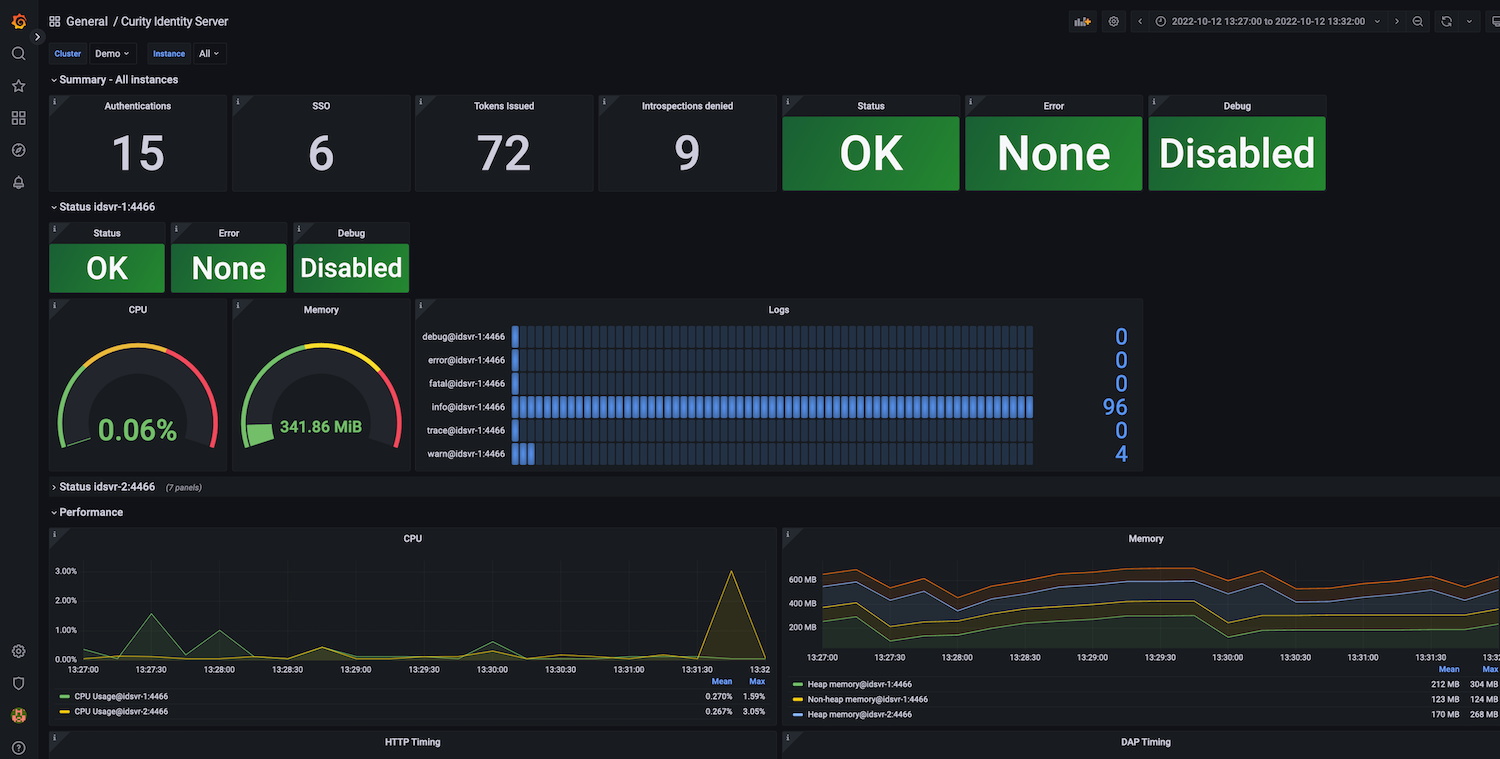
- For each selected instance another summary including the status, cpu, memory and logs is shown.
- The performance section shows metrics including HTTP timing and datasource access time
- The authentication section lists metrics related to tokens and logins.
Summary
The overall summary shows the number of tokens issued, sso events and login events registered during the selected dashboard time. It also gives an indication over the status of all instances. If any of the instances is down, registered an error or debug logs the dashboard will show a warning, giving you a quick overview if something needs to be fixed.
Instance Summary
This section lists the status per selected instance. It shows if the service is up and if any error or debug messages were registered. In addition the section prints the current CPU and memory usage as well as statistics about the log messages collected.
Performance
The performance section views CPU and memory usage in more detail. It also provides graphs for the time needed to process HTTP or datasource requests.
Authentication
In this section you see details about authentication related events. Rates are calculated per seconds and give you an indication over how busy the system is.
JDBC Connection Pool
This sections includes metrics related to the connection pool of JDBC data sources. It provides information about the work load, that is the ratio of available to active connections, processing and waiting time as well as the number of pending threads waiting to get an active connection assigned.
Contribution
Feedback and contribution is welcome. Contact us at grafana@curity.io. Feel free to improve the dashboard by contributing to the repository on GitHub.
Further Information
A detailed description of the dashboard can be found in Curity's resource library.
For more information about Curity Identity Server please visit https://curity.io
Data source config
Collector config:
Upload an updated version of an exported dashboard.json file from Grafana
| Revision | Description | Created | |
|---|---|---|---|
| Download |