Redis Dashboard for Prometheus Redis Exporter 1.x
Redis Dashboard for Prometheus Redis Exporter 1.x, it works with multiple Prometheus instances and name spaces in k8s
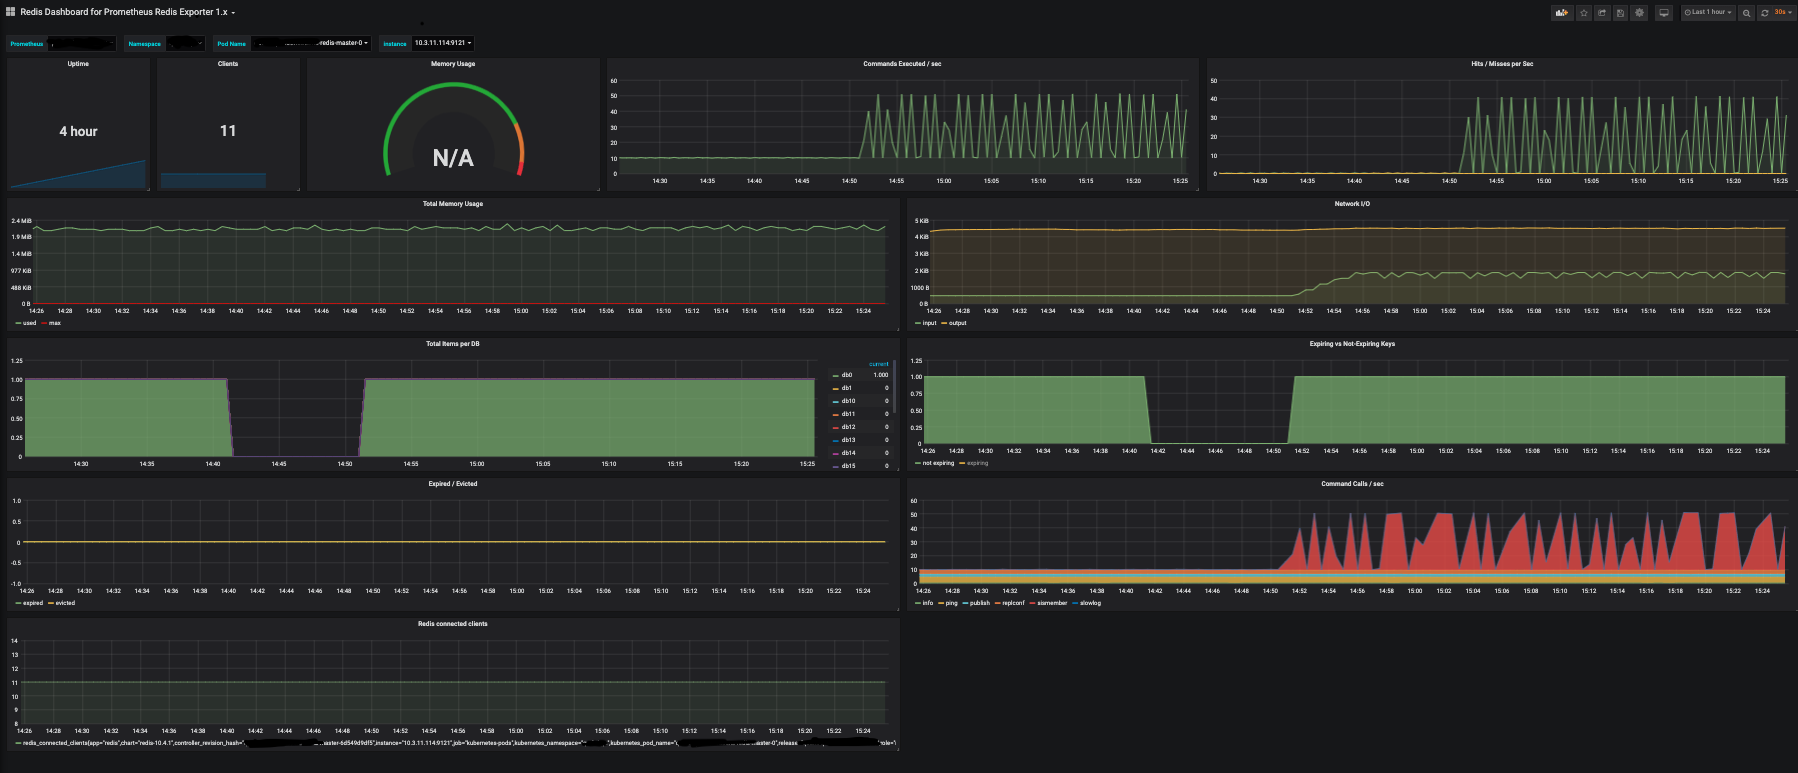
The Redis Dashboard for Prometheus Redis Exporter 1.x dashboard uses the prometheus data source to create a Grafana dashboard with the graph and singlestat panels.
Data source config
Collector type:
Collector plugins:
Collector config:
Revisions
Upload an updated version of an exported dashboard.json file from Grafana
| Revision | Description | Created | |
|---|---|---|---|
| Download |
Metrics Endpoint (Prometheus)
Easily monitor any Prometheus-compatible and publicly accessible metrics URL with Grafana Cloud's out-of-the-box monitoring solution.
Learn more