Pod Resources
This is for insight on important Kubernetes app metrics. What recources is a Pod actually using and what are it's limits or requests and what part is each container consuming? Also has graphs for networking, disks, restarts docker images etc
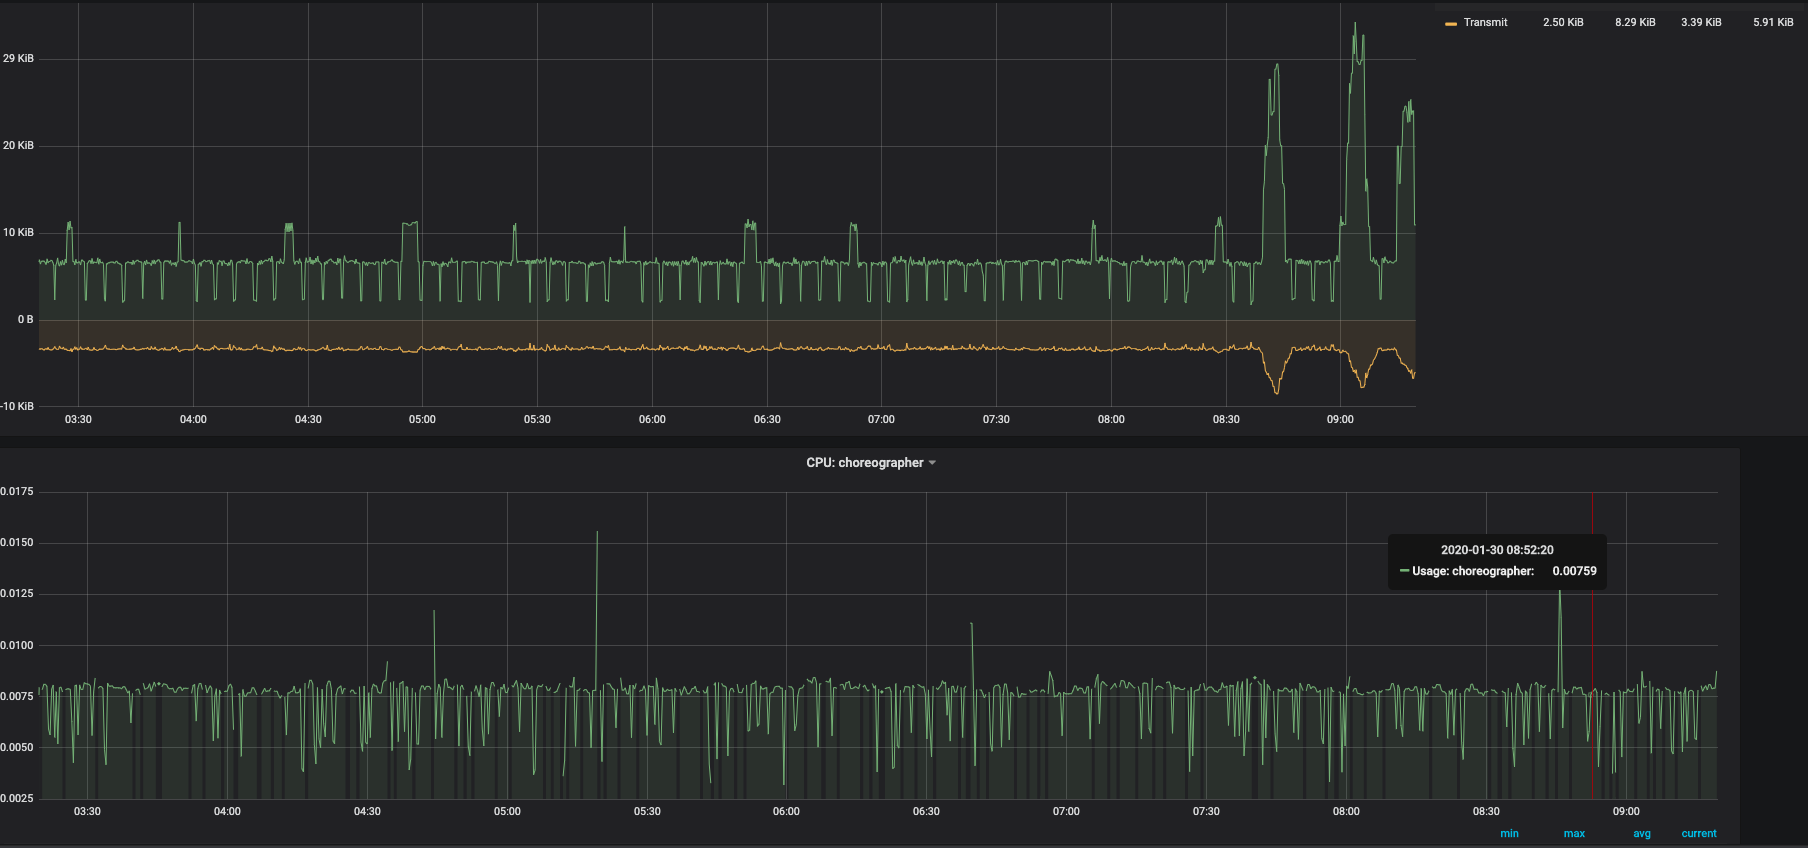
The Pod Resources dashboard uses the prometheus data source to create a Grafana dashboard with the graph, singlestat and table panels.
Data source config
Collector type:
Collector plugins:
Collector config:
Revisions
Upload an updated version of an exported dashboard.json file from Grafana
| Revision | Description | Created | |
|---|---|---|---|
| Download |