
K8s Cluster Metrics
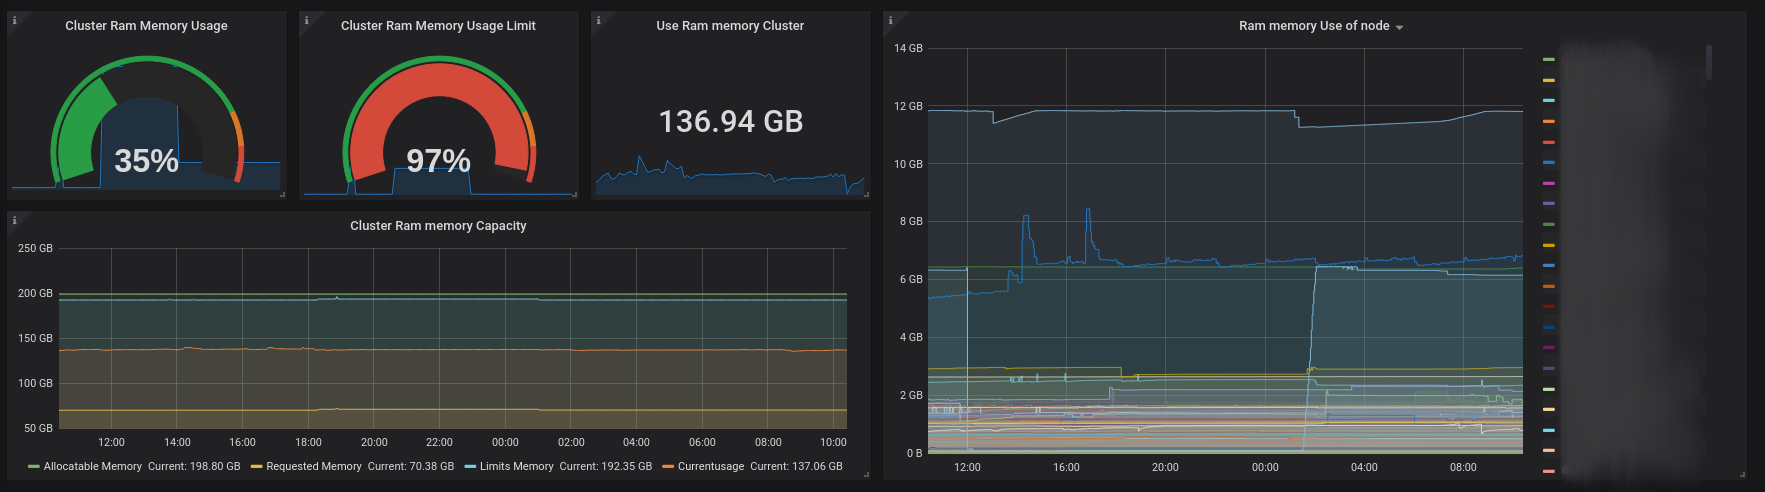
Dashboard of use from resource of cluster of Kubernetes. In this Dashboard it see: State of containers from Cluster, State of Pods from Cluster, State of Jobs from Cluster, Deployment and ReplicationController state of Cluster, Nodes number and state of they, Network Activity by namespaces, CPU use in the cluster and CPU use in the cluster by namespaces, Ram memory use in the cluster and Ram memory use in the cluster by namespaces.
Dashboard of use from resource of cluster of Kubernetes. In this Dashboard it see:
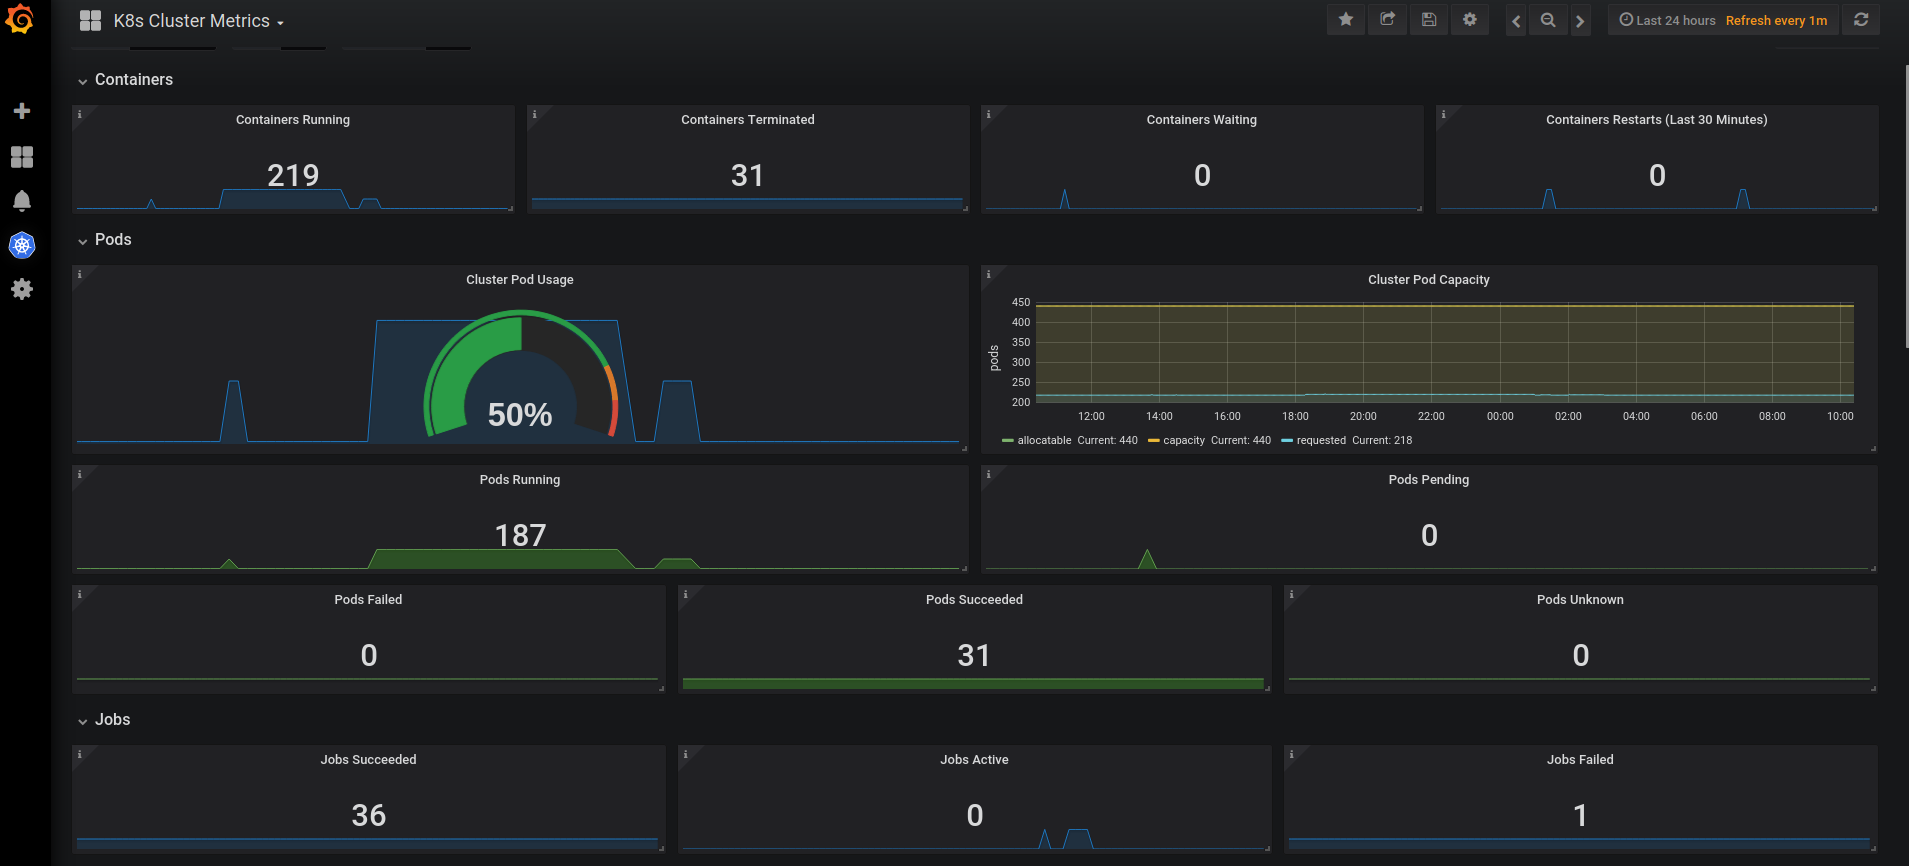
- State of containers from Cluster.
- State of Pods from Cluster.
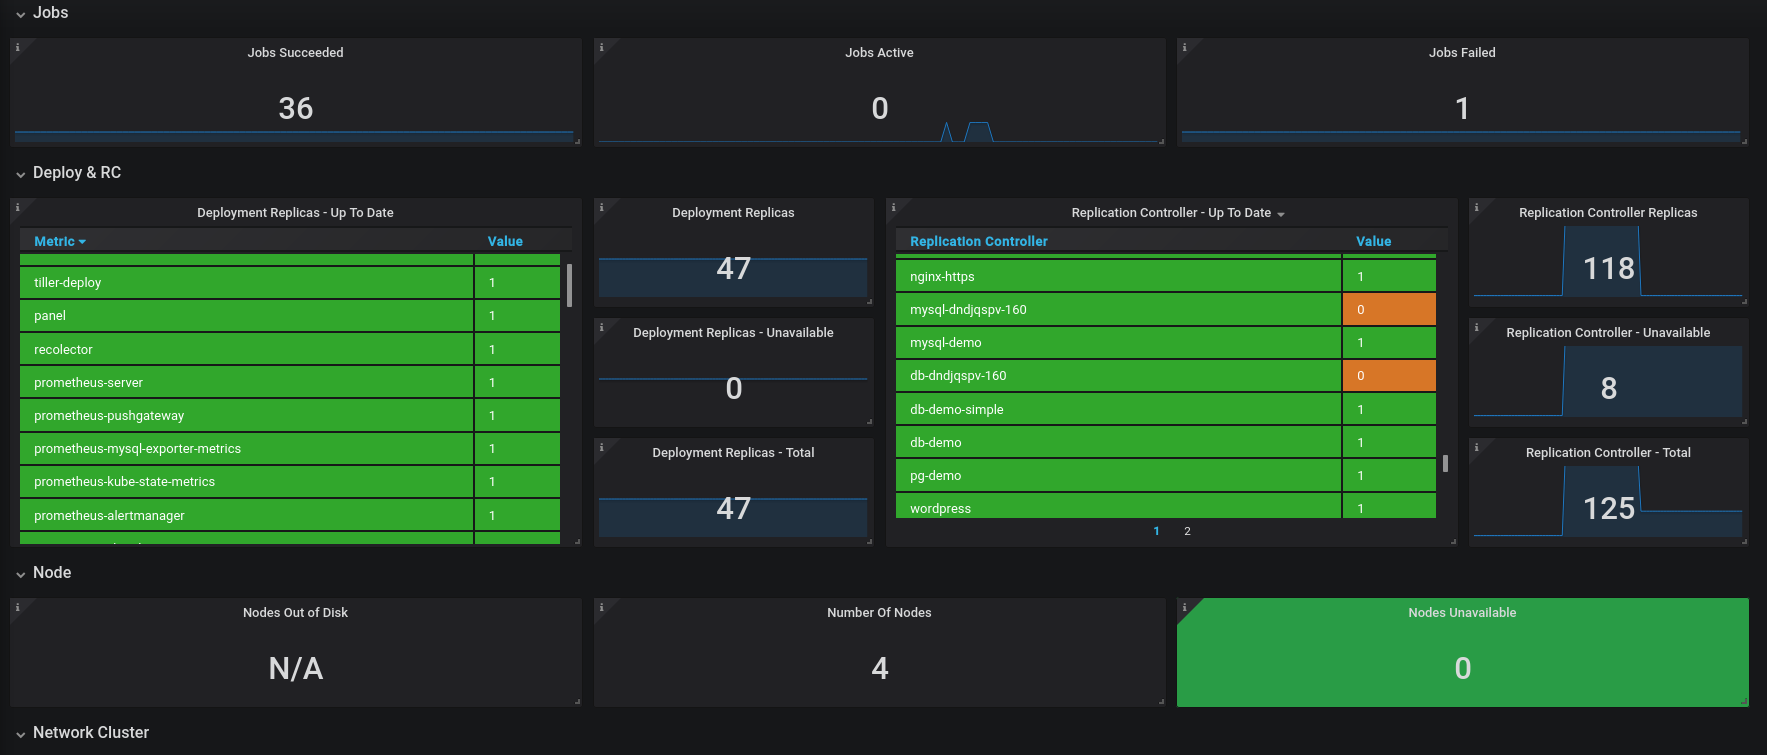
- State of Jobs from Cluster.
- Deployment and ReplicationController state of Cluster.
- Nodes number and state of they
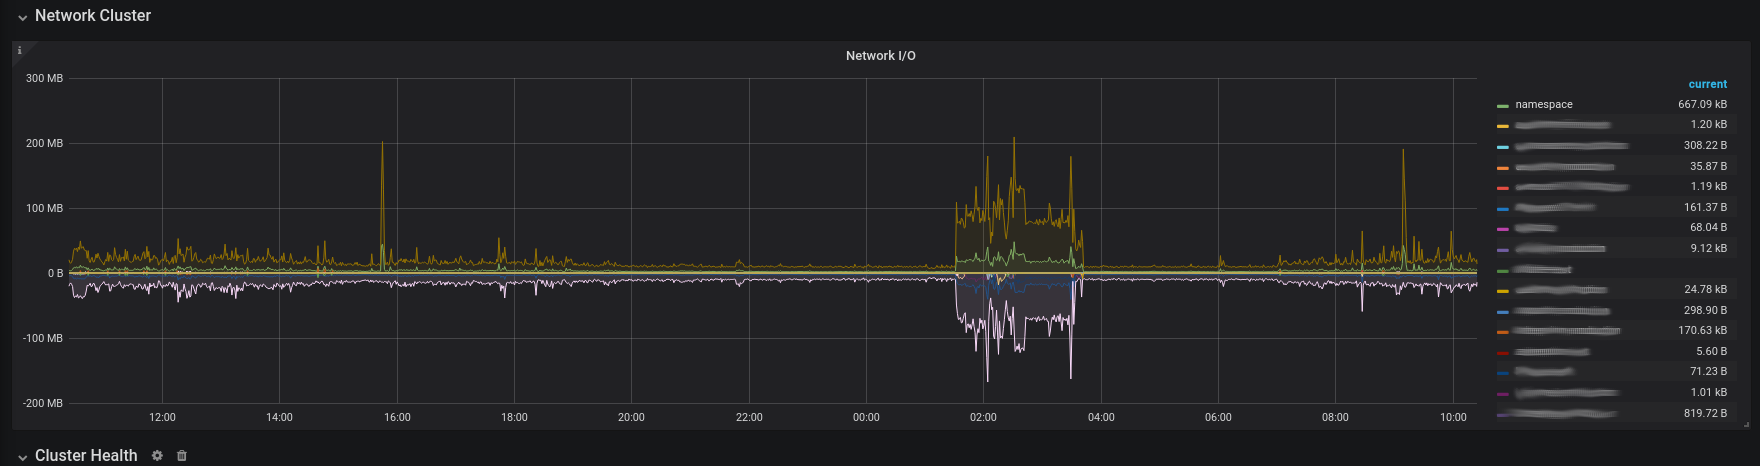
- Network Activity by namespaces.
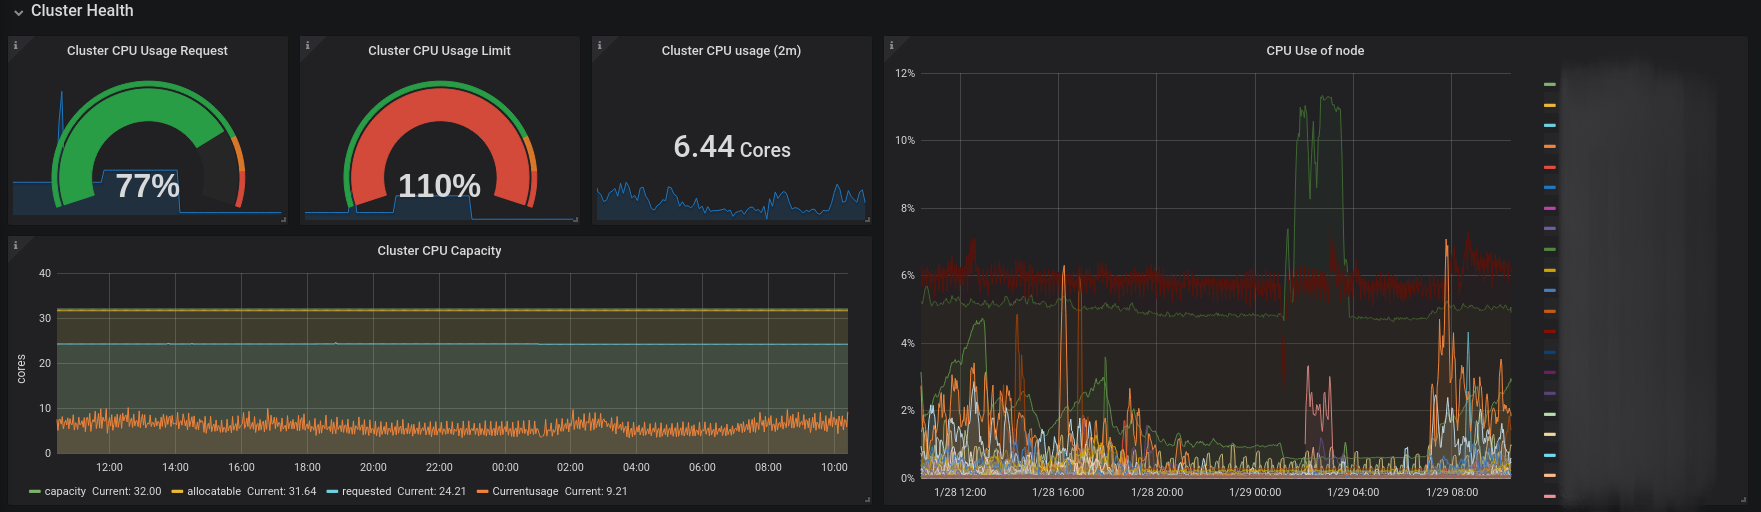
- CPU use in the cluster and CPU use in the cluster by namespaces.
- Ram memory use in the cluster and Ram memory use in the cluster by namespaces.
Data source config
Collector type:
Collector plugins:
Collector config:
Dashboard revisions
Upload an updated version of an exported dashboard.json file from Grafana
| Revision | Decscription | Created | |
|---|---|---|---|
| Download |
Sign up for Grafana Cloud

Get up and running in minutes with the Grafana Cloud free tier, which includes free forever 10k metrics, 50GB logs, 50GB traces, 500 VUh, and more.
Get this dashboard
Data source:
Dependencies: