
K8s Cluster Metrics
Dashboard of use from resource of cluster of Kubernetes. In this Dashboard it see: State of containers from Cluster, State of Pods from Cluster, State of Jobs from Cluster, Deployment and ReplicationController state of Cluster, Nodes number and state of they, Network Activity by namespaces, CPU use in the cluster and CPU use in the cluster by namespaces, Ram memory use in the cluster and Ram memory use in the cluster by namespaces.
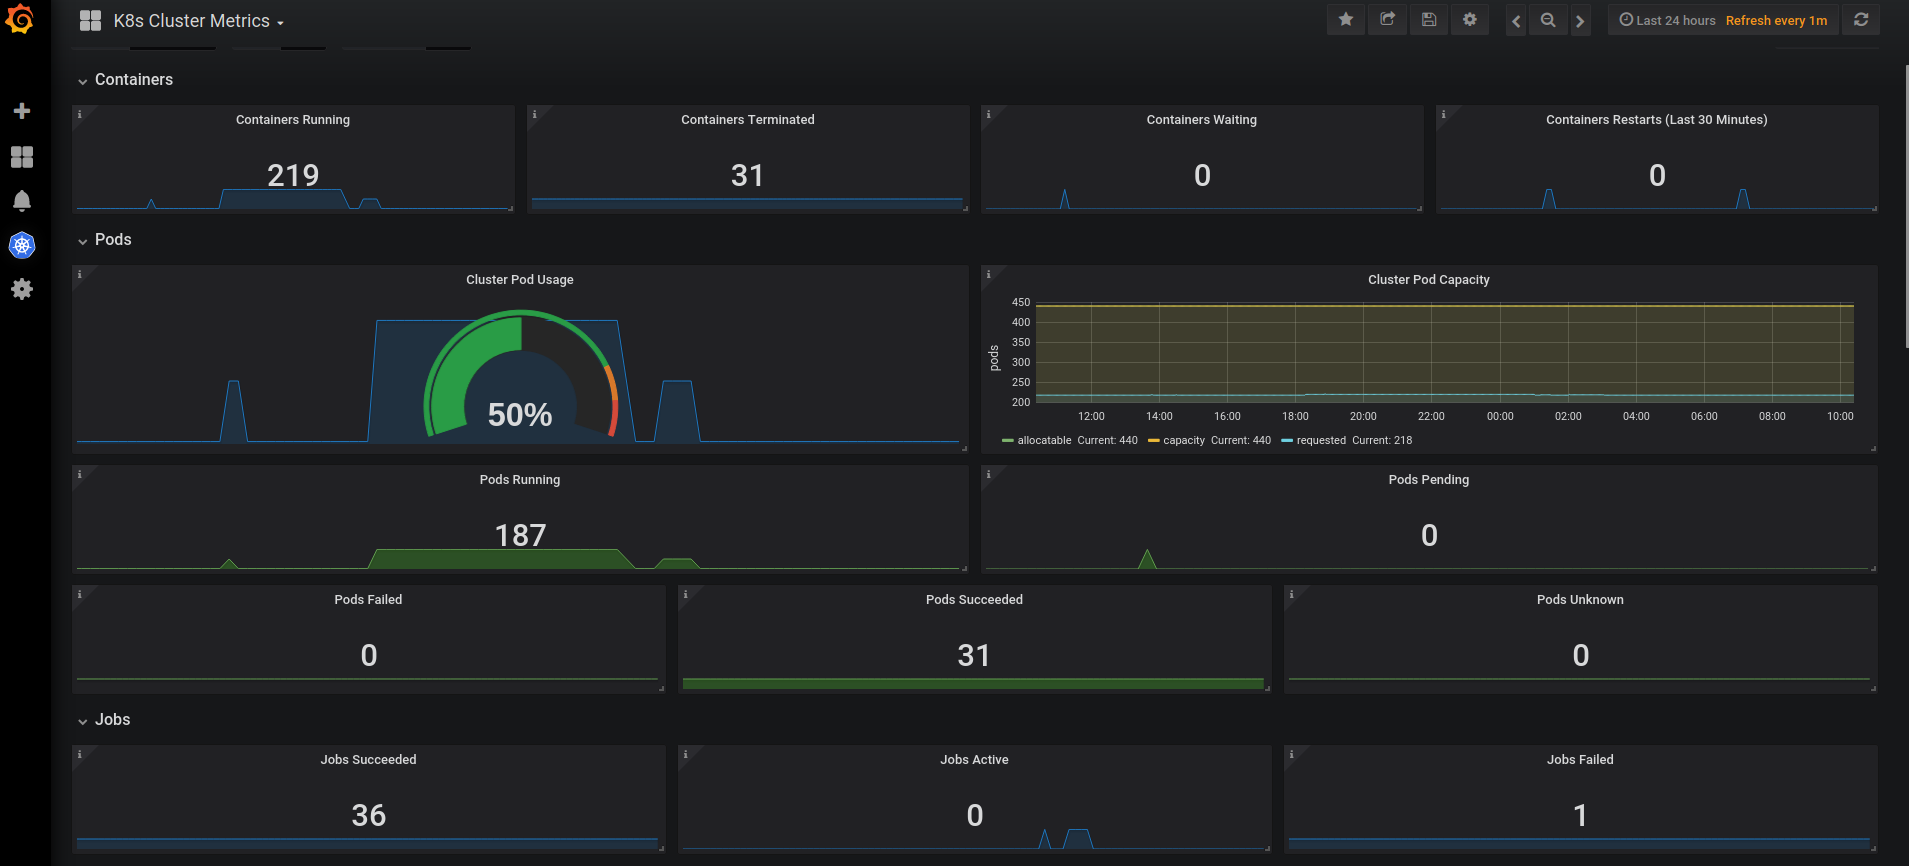
Dashboard of use from resource of cluster of Kubernetes. In this Dashboard it see:
- State of containers from Cluster.
- State of Pods from Cluster.
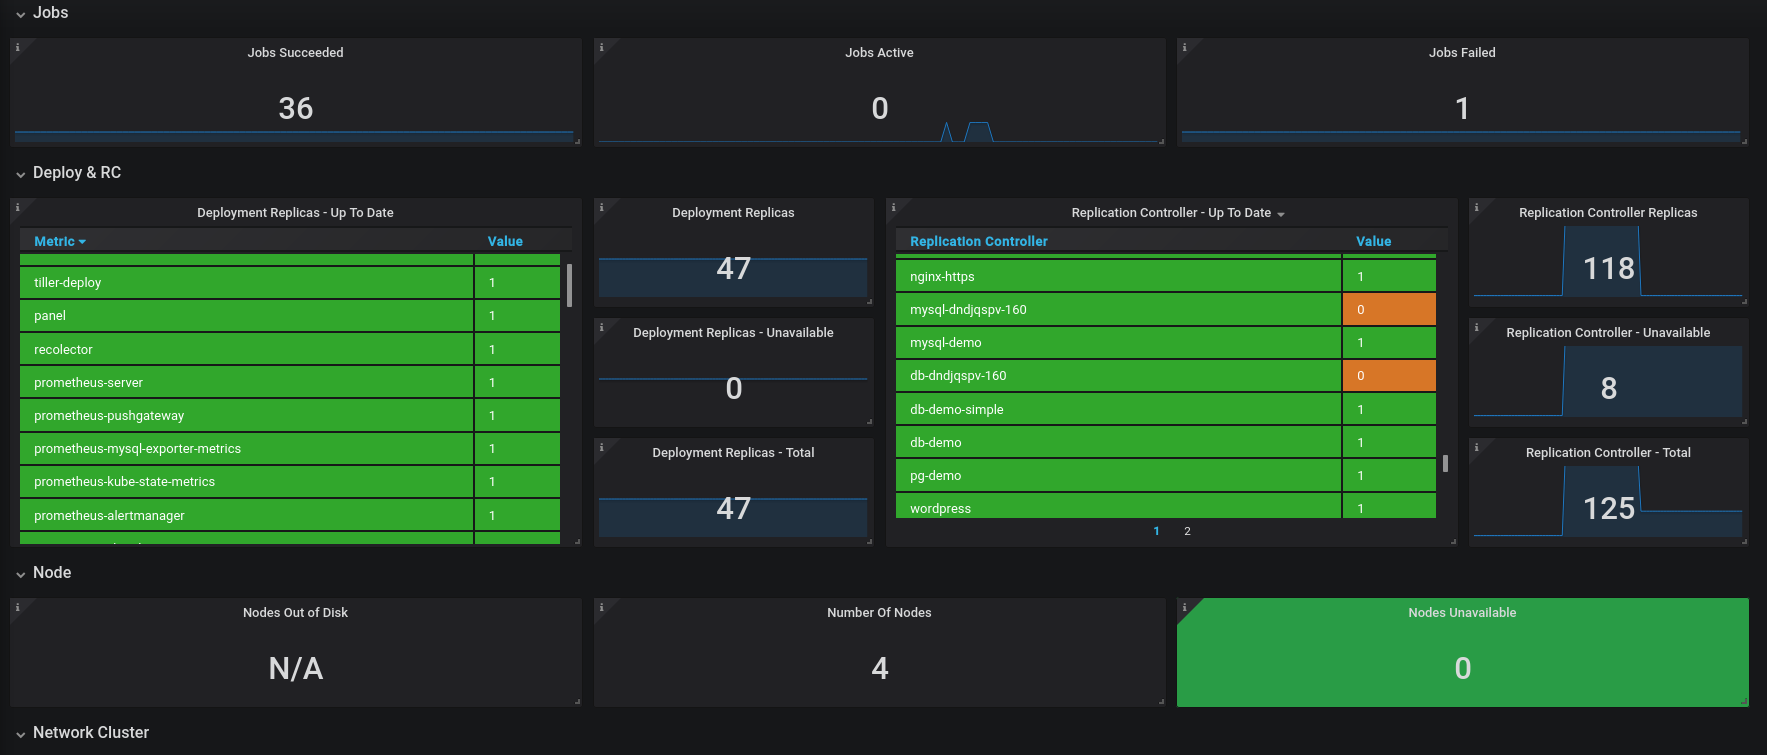
- State of Jobs from Cluster.
- Deployment and ReplicationController state of Cluster.
- Nodes number and state of they
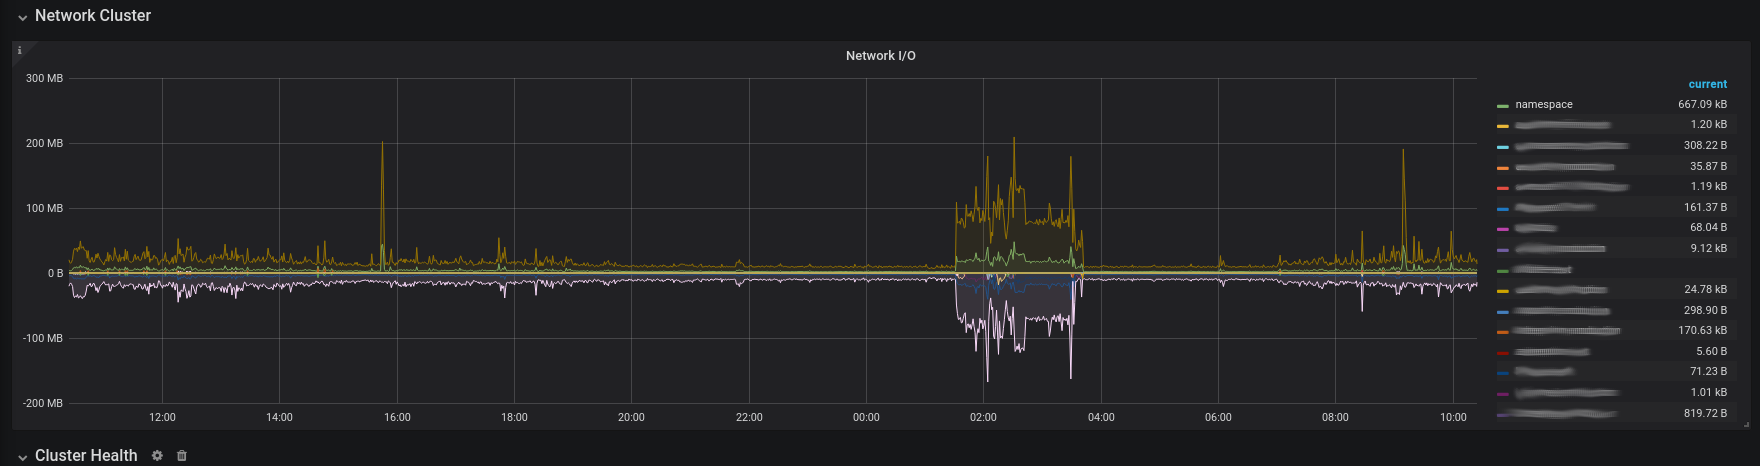
- Network Activity by namespaces.
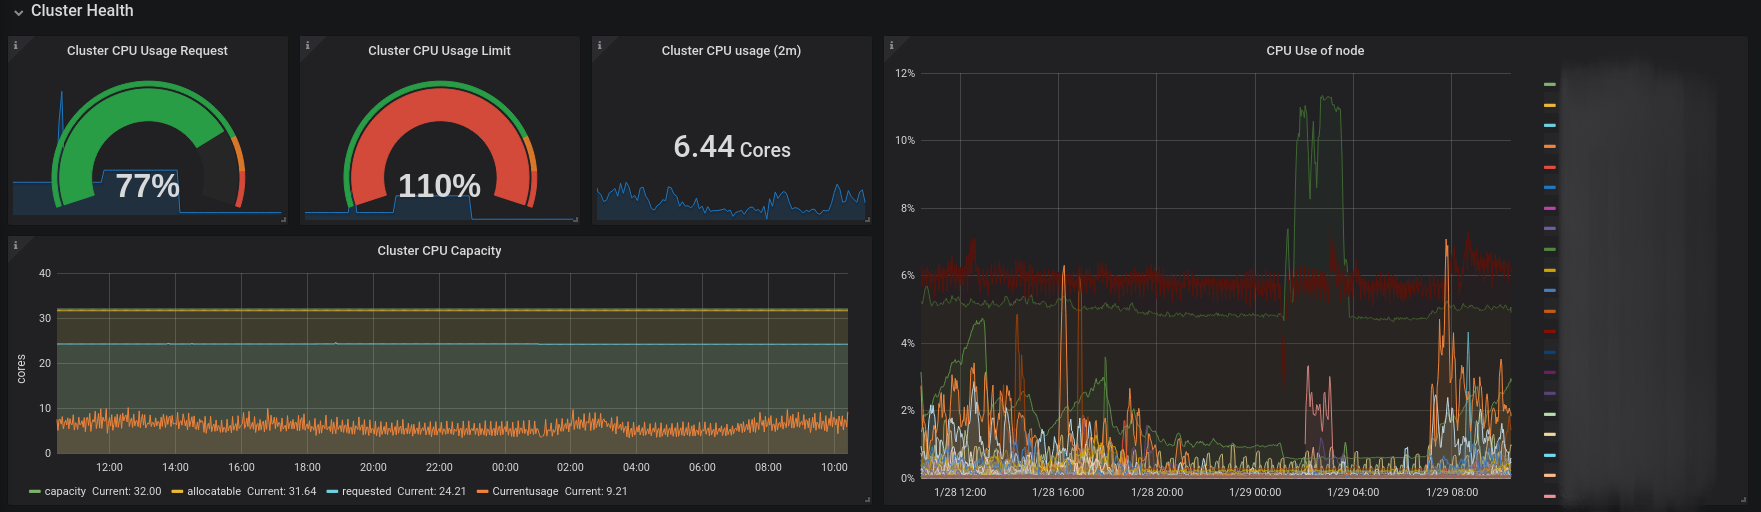
- CPU use in the cluster and CPU use in the cluster by namespaces.
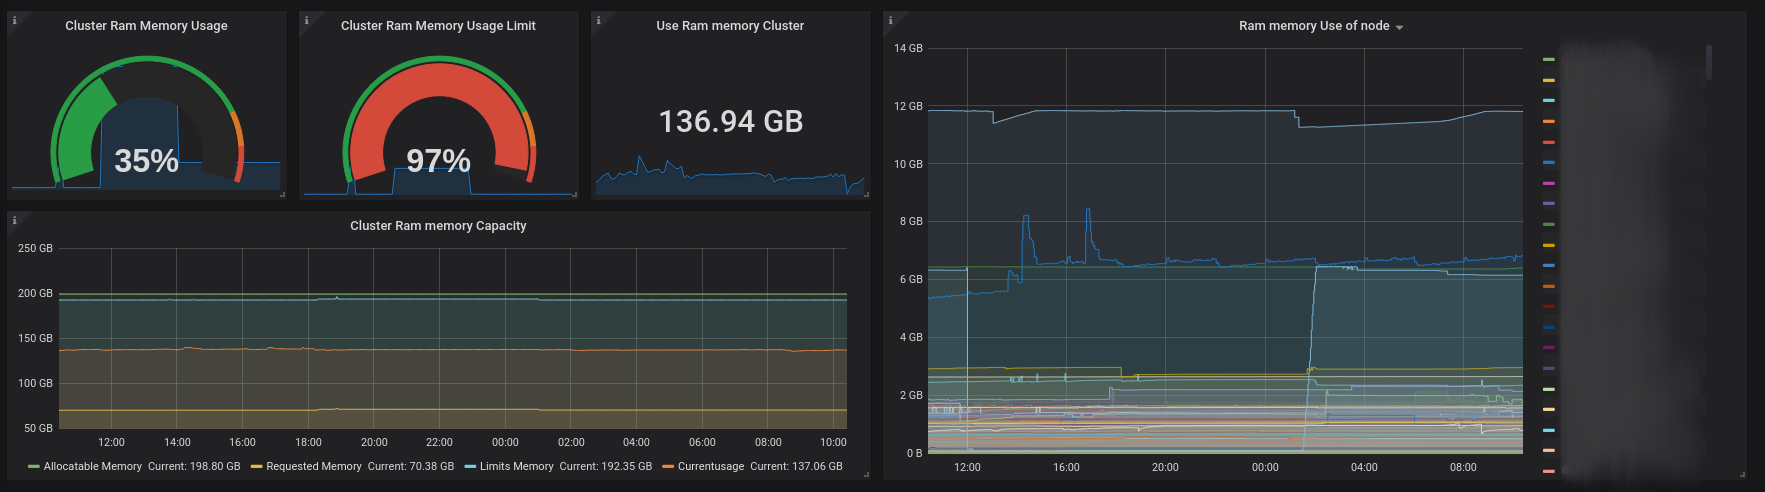
- Ram memory use in the cluster and Ram memory use in the cluster by namespaces.
Data source config
Collector config:
Upload an updated version of an exported dashboard.json file from Grafana
| Revision | Description | Created | |
|---|---|---|---|
| Download |
Kubernetes
Monitor your Kubernetes deployment with prebuilt visualizations that allow you to drill down from a high-level cluster overview to pod-specific details in minutes.
Learn more