RabbitMQ
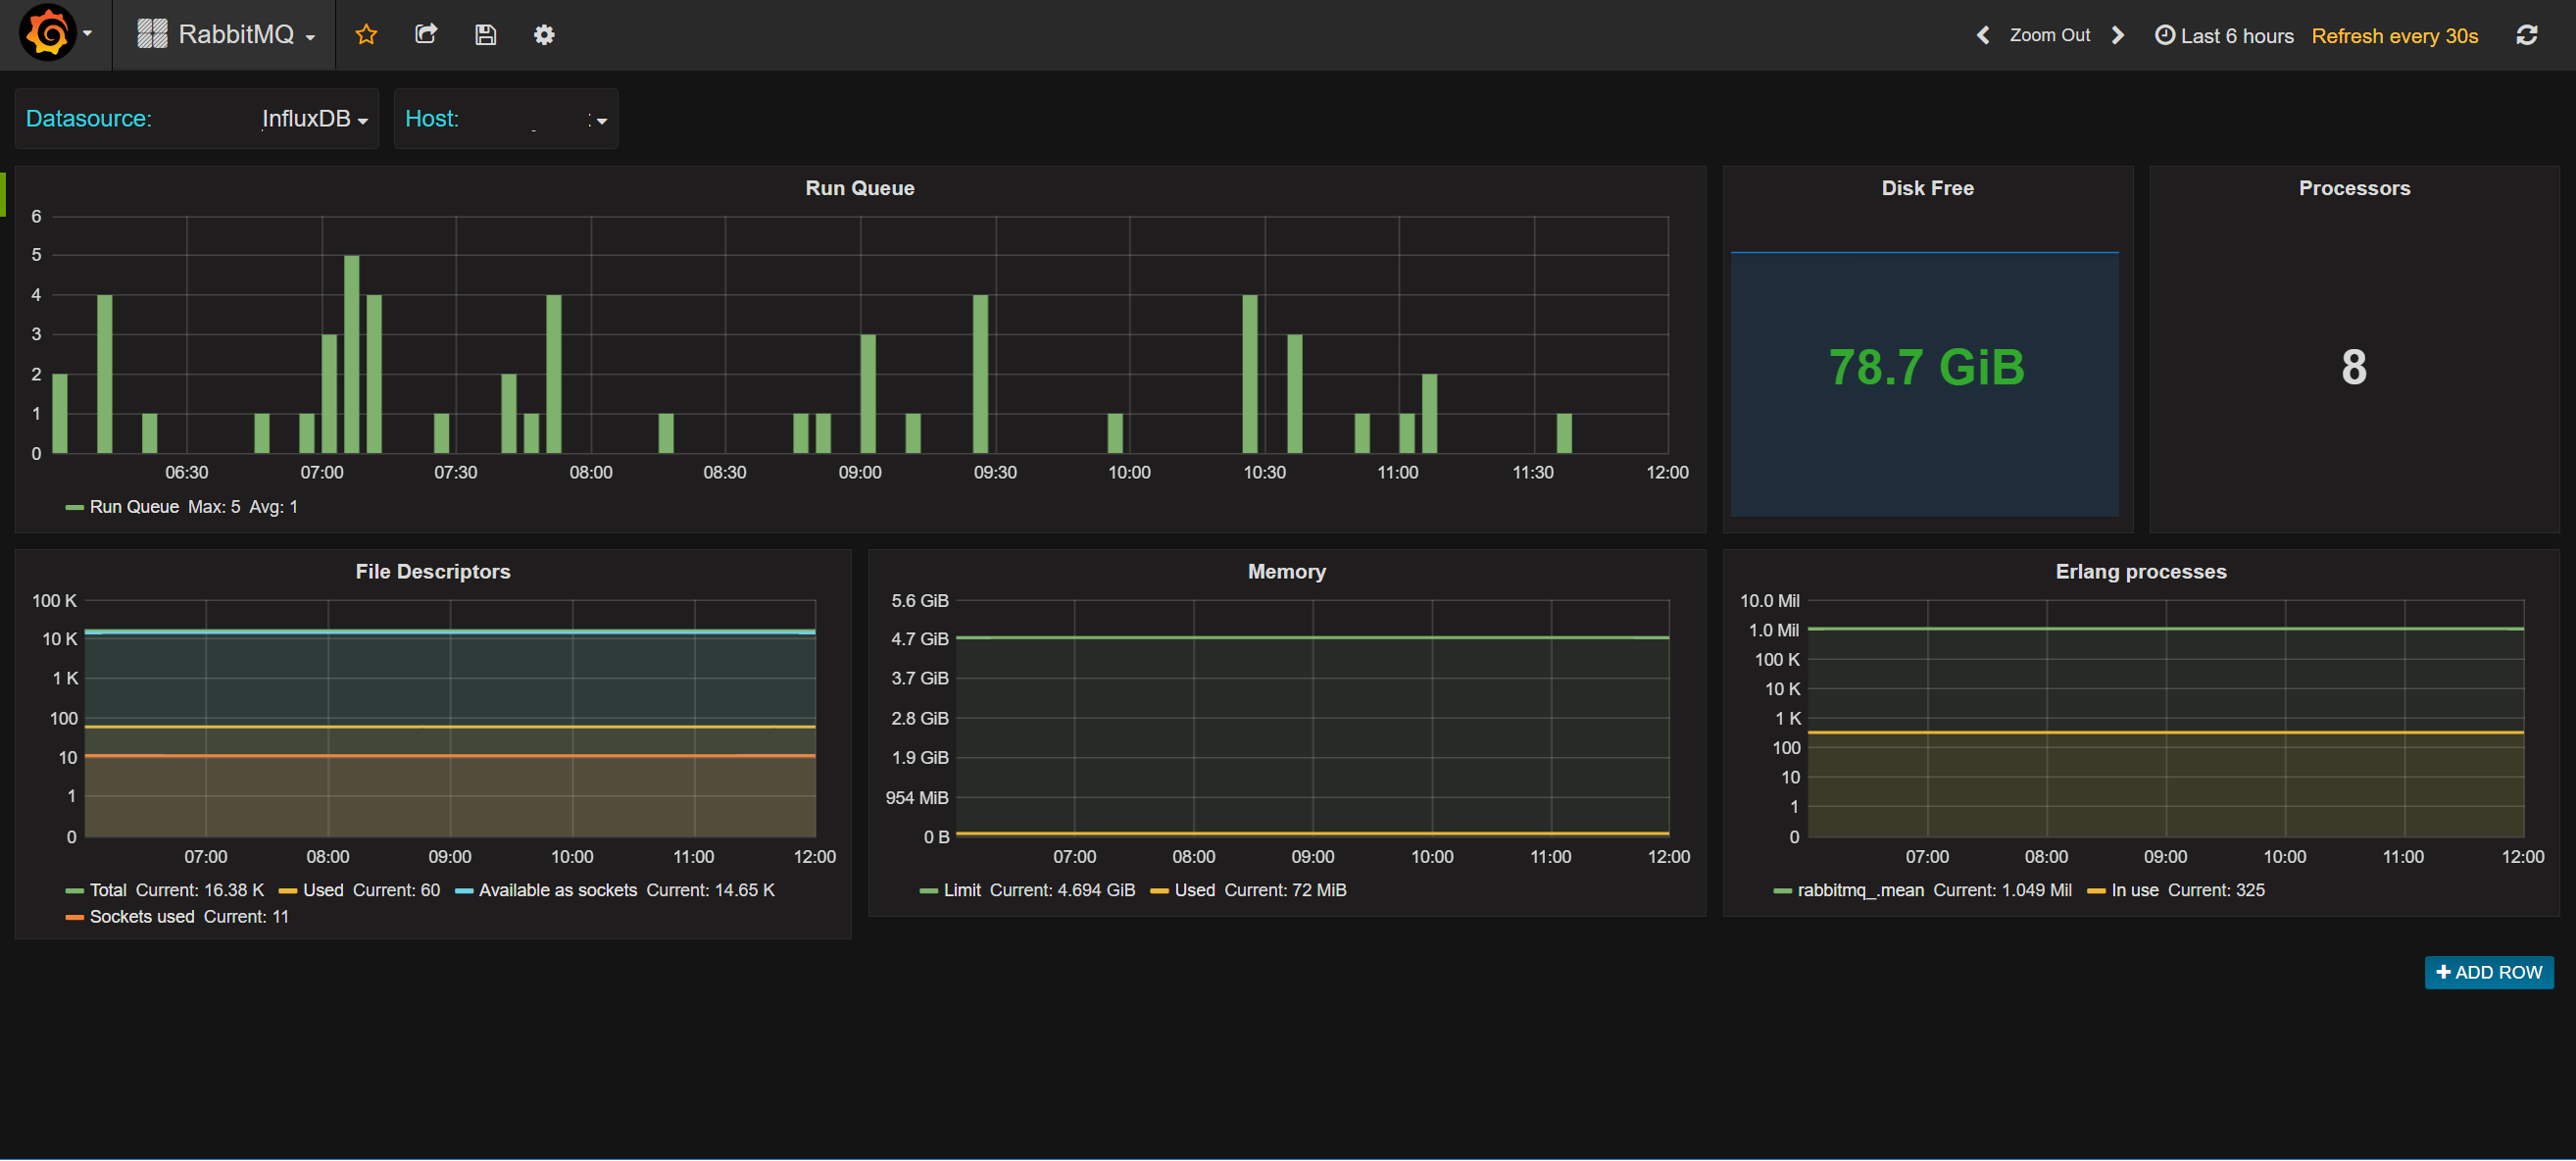
Statistics from the RabbitMQ management interface covering Erlang processes, run queue, file descriptors and memory usage
Metrics collected by the RabbitMQ plugin for CollectD at: https://github.com/NYTimes/collectd-rabbitmq
Metrics include:
- Run Queue
- File descriptors available and used. File descriptors available as sockets, and sockets used
- Disk free as seen by RabbitMQ
- Processors seen by RabbitMQ
- Memory available and used by RabbitMQ
- Erlang processes available and in use
Data source config
Collector config:
Upload an updated version of an exported dashboard.json file from Grafana
| Revision | Description | Created | |
|---|---|---|---|
| Download |
RabbitMQ
Easily monitor RabbitMQ, the most widely deployed open source message broker, with Grafana Cloud's out-of-the-box monitoring solution.
Learn more
